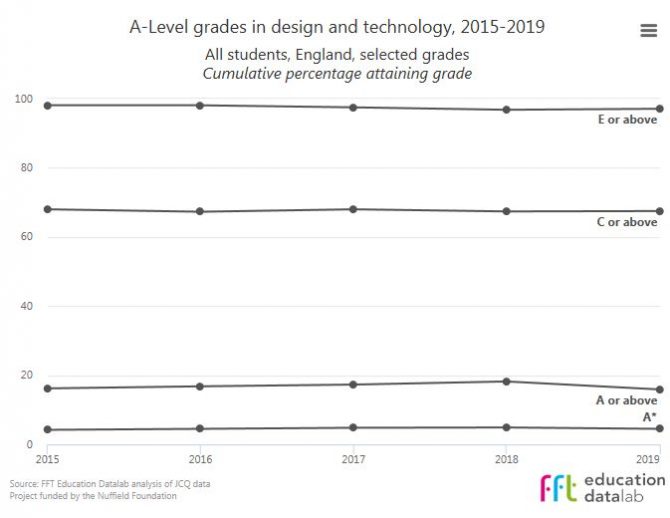
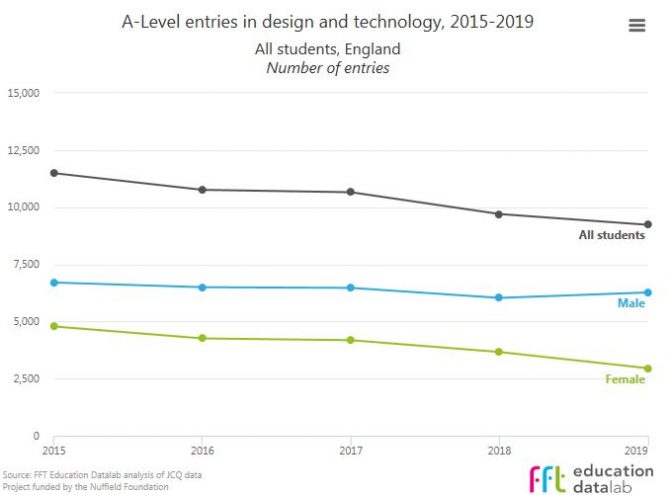
These are the trend tables for A-level Design and technology, 2015-2019.
Compiled by Education Datalab, the tables show entries have decreased slightly, falling from 9,703 last year to 9,231 this year.
The proportion reaching the top grades has also decreased, with 4.5 per cent achieving an A* (down from 4.9 per cent last year) and 15.9 per cent getting an A or A*, down from 18.2 per cent.
For other subjects, visit our main subject tables page.
A-level Design and technology results: England

A-level Design and technology entries: England

For our own analysis, you can read about the 5 key trends in England’s data, to find out which subjects are increasing or declining in popularity, or our stories on girls overtaking boys in science and Spanish becoming the most popular language.
You can also read our headline story on the slump in top grades, with the proportion of pupils getting A or A* reaching its lowest level in 12 years.

Your thoughts