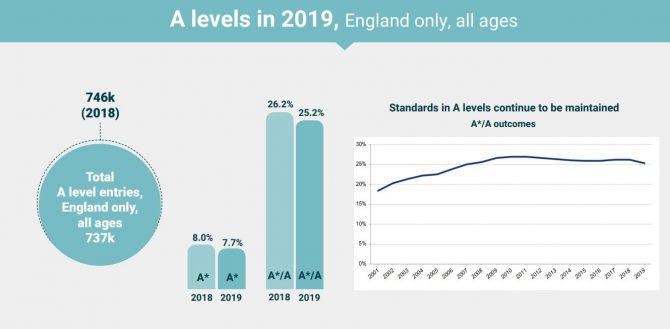
The proportion of top A-level grades handed out to pupils in England has fallen to its lowest level in 12 years.
In England this year, 25.2 per cent of entries received an A or A* grade. This is a full percentage point drop from the last two years, when 26.2 per cent achieved the grades in both 2018 and 2017.
It is the lowest proportion achieving the top grades since 2007, when 25 per cent of student entries achieved an A. The A* grade was introduced in 2010.
The proportion of A* grades also fell again this year to 7.7 per cent – the lowest since 2013.
Last year, eight per cent of entries were awarded the top grade, down from 8.3 per cent in 2017.
At a media briefing on Thursday morning, heads of the exam boards defended the grade boundaries and the level of difficulty for the exams, attributing the decline in top grades to the “different cohort” of students sitting the tests.
Ofqual echoed this, saying this year’s drop in top grades is likely to reflect “changes in the A-level cohort and students’ subject choices”. (Education Datalab also has dug a little deeper into the subject choice changes here).
However, despite the decline in top grades the overall pass rate has remained stable in England this year, with 97.5 per cent of entries receiving a grade E or above, down only slightly from 97.6 per cent last year.
The number of entries overall in the UK fell by 1.3 per cent this year, but still represented an increase as a proportion of 18-year-olds (the 18-year-old population declined 2.9 per cent in 2019).
Dr Philip Wright, director general of JCQ, said: “All students across the UK receiving their A-level results today should be proud of their achievements. They have worked hard over the last two years and it is a moment for them, together with their teachers, families and friends to celebrate.”

Top A-level grades over the years
% of A* and A grades in England, 2007 to 2019
2019: 25.2%
2018: 26.2%
2017: 26.2%
2016: 25.8%
2015: 25.9%
2014: 26.1%
2013: 26.3%
2012: 26.5%
2011: 26.8%
2010: 26.8%
2009: 26.5%
2008: 25.6%
2007: 25%
(Figures before 2010 do not include A* grade)
Clarification: We have amended this article to make it clear that top grades had fallen as a proportion of entries, not students.


Your thoughts