The Department for Education has today published the latest school workforce census (November 2018). Schools Week has the key findings:
1. Teacher numbers are up, but it’s outstripped by the rise in pupils
The number of teachers working in the profession (453,400 full-time equivalents) has increased a teeny bit – up 0.3 per cent on 2017.
However this rise was driven by primary teachers – the number of secondary teachers actually dropped. There was a 0.5 per cent increase of nursery and primary teachers, compared to a 0.3 per cent fall in secondary.
We’re in a position again where the number of entrants is more than the number of leavers (well, just about – but it’s better than last year when more teachers left the profession than joined!)
However, when compared to the number of pupils, it’s extra worrying. The number of pupils in the school system as a whole rose by 0.8 per cent overall to 8,735,098 in 2018. So the number of extra pupils has outstripped the small rise in teachers. (New figures today show it has continued to rise, too).
2. Teacher retention rates are getting worse, too
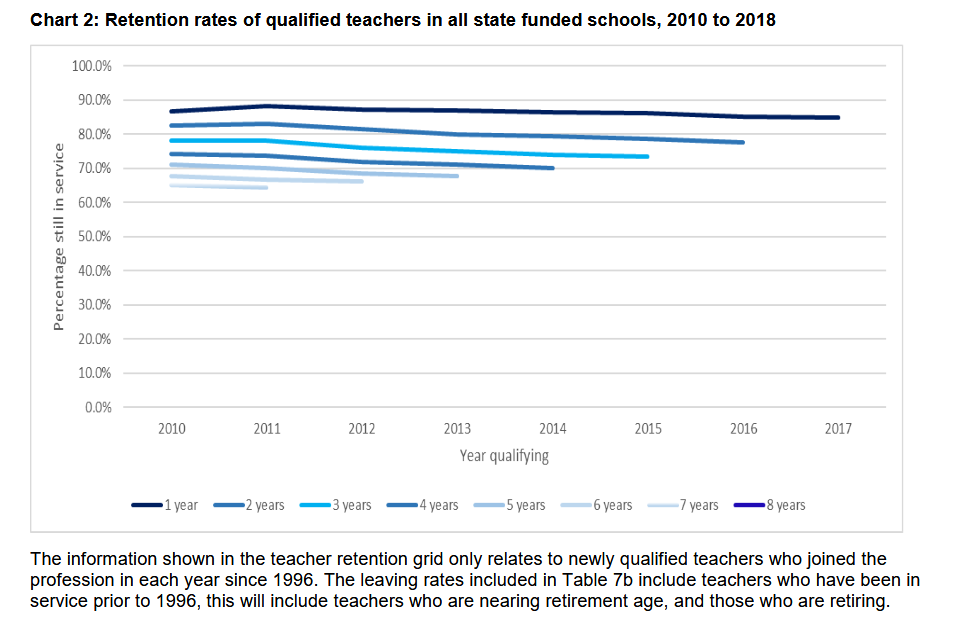
Of the teachers who qualified in 2017, 84.7 per cent are still in service one year after qualifying. That’s slightly lower than the previous year’s one-year retention rate of 85.1 per cent.
Worryingly, the five-year retention rate has also dropped to 67.7 per cent for those who qualified in 2013, compared to 68.5 per cent in the previous year.

3. So who is leaving?
There were 44,600 FTE qualified new entrants in state funded schools in 2018, just over half were newly-qualified teachers, and 16,400 were returning to the sector.
However, there were also 42,100 that left. That’s mostly 35,600 qualified teachers who are out of service (which the DfE hopes “may come back as returners in a later year and those leaving the profession”). A total of 6,300 qualified teachers retired, and 130 teachers died during the year.
But the overall leaver rate last year was 9.8 per cent – lower than the 10.2 per cent in 2017.
4. Teachers ARE taking up flexible working, but it’s driving a decrease in numbers
It looks like more teachers are taking up flexible working hours.
While 18,500 teachers increased their working hours, a greater number (25,300 or five per cent) decreased their hours. But, beware: “Between 2017 and 2018, such changes in working pattern produce a decrease equivalent to approximately 3,000 FTE qualified teachers”.
There are two sides to this: one argument goes, if more teachers take up flexible working then we’ll have fewer teachers available. The other states that if you increase flexible working then you will gain teachers because more of those who left the profession would come back.
We don’t think this stat proves either, but it’s interesting nonetheless.
5. Pupil teacher ratios are increasing in secondaries
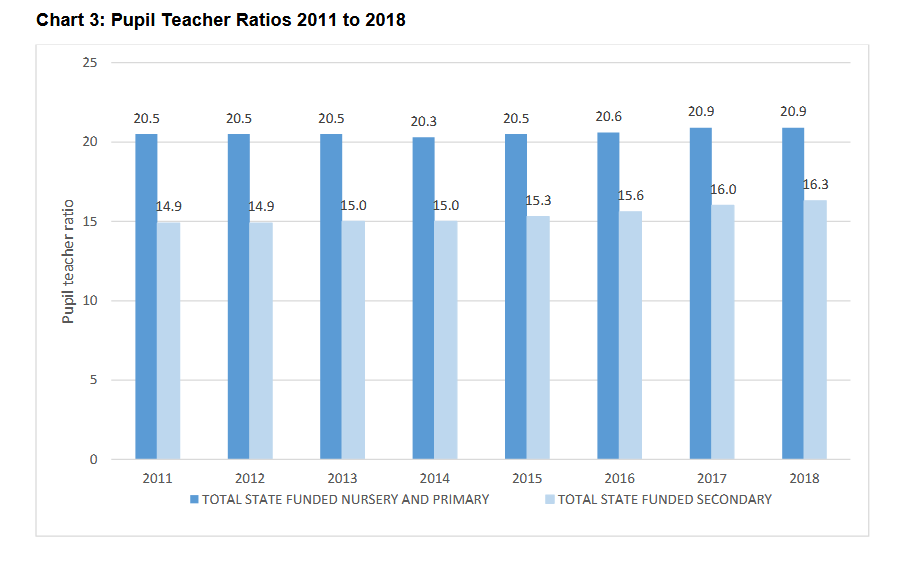
The ratio of pupils to teachers has remained stable or increased slightly for all school types except primary academies (where it fell from 21.2 in 2017 to 21 in 2018).
In secondaries, the ratio was 16.3, up from 16 in 2017. The ratio has been rising year-on-year since 2012 (when it was just 14.9!)

6. Teacher pay has risen, and men still get paid more
The average salary for teachers in state-funded schools was £39,500 per year – an increase of £810 compared to 2017 (around a two per cent increase).
But average salaries are higher for male teachers across all grades. Male classroom teachers get paid £36,900, compared to £36,000 for women. The gap widens at leadership grades – with the average pay for men £62,700 compared to £57,200 for women.
7. Academy bosses get paid more than their LA counterparts (but teachers get less!)
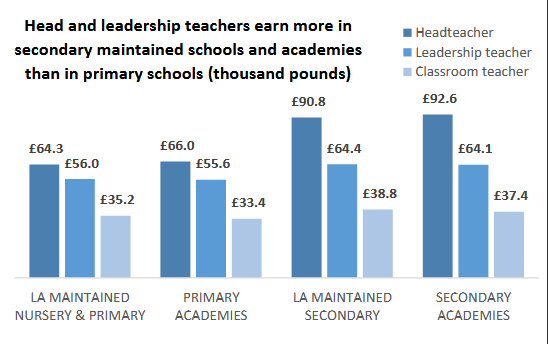
Heads earn more in academies – £92,600 in secondary academies, compared to £90,800 in council-maintained secondaries.
BUT, secondary classroom teachers in academies actually earn less – £37,400 in academies, compared to £38,800 in maintained schools.

8. Schools are spending less time teaching non-EBacc subjects
Last year, 67.4 per cent of teaching hours at key stage 4 were spent teaching the EBacc. This was 64.4 per cent of teaching hours at key stage 3.
Just 32.6 per cent of teaching hours at key stage 4 were spent on non-EBacc subjects, and 35.6 per cent at key stage 3, which the report stated was “slightly lower” than in 2017.


Re Point 5: It’s the ratio of pupils to teachers, not the other way round!
All this may be worrying, but it is not at all surprising. The system has been broken since about 1970 and, I’m afraid, successive governments have been reforming it beyond repair ever since. My guess is it’ll have to fail utterly and be rebuilt from scratch at this point. Only acceptable working conditions and workloads will lead to adequate levels of teacher retention.