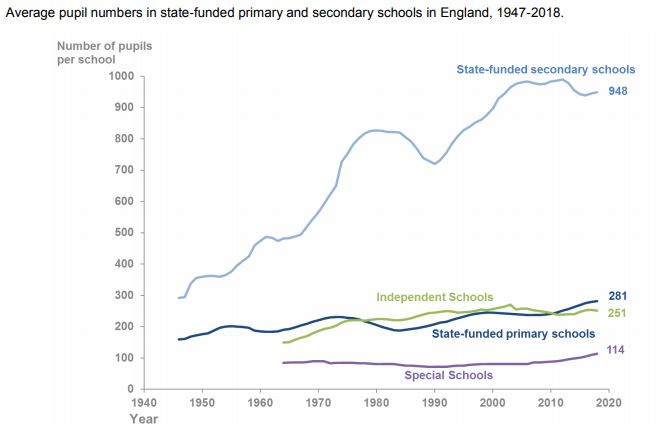
Schools are getting bigger as pupil numbers continue to rise.
New data on schools, pupils and their characteristics data shows primary and secondary schools had an extra two pupils on average on their rolls in January compared with the same time last year, though special schools are growing even more.
Here’s what we learned from the data.
1. Schools are getting bigger
The average secondary school now has 948 pupils, two more than last year. Primary schools have an average of 281 pupils. Again, this is a rise of two since last year.
Special schools grew more, with average pupil numbers up from 110 in 2017 to 114 this year.
The number of pupils in the school system as a whole has risen by 0.8 per cent overall, or just over 66,000 pupils, to 8,735,098. The number of pupils in state-funded secondary schools rose for the fourth year in a row, reflecting the move of a population bulge into the secondary phase.

2. Fewer pupils are on free school meals
The proportion of pupils eligible for and claiming free school meals was 13.6 per cent in January, down from 14 per cent last year, and the lowest rate since data was first collected in 2001.
The decrease is put down to the fact that fewer families are receiving income-related benefits, on which free meal eligibility is based.
In primary schools, 13.7 per cent of pupils are eligible for free schools, compared with 14.1 per cent last year. In secondary schools, 12.4 per cent of pupils were eligible, compared with 12.9 per cent last year.
Out of all school types, secondary academies have the lowest proportion of free school meal claimants, with 12.3 per cent of pupils on free school meals compared with 12.9 per cent across all secondary schools.
However, primary academies have a higher than average rate of eligibility, with 15.8 per cent of pupils eligible for FSM, compared with 14.1 per cent across all primary schools. This is a similar trend to last year.
3. More pupils are in academies or free schools
Last year, 62 per cent of all secondary school pupils were in academies or free schools. That has now risen 10 percentage points to 72 per cent. The rise reflects the fact that 72 per cent of secondary schools are academies.
In January 2018, 30 per cent of primary school pupils were in academies, compared with 24 per cent in January 2017.
Overall, nearly 3.8 million pupils now attend academies and free schools out of 8.74 million pupils in all schools.
4. There are 35 more schools
Between January 2017 and 2018, there was a net increase of 35 in the number of schools open in England. The total is now at 24,316.
This is driven by a rise in the number of state-funded secondary schools (28 more than in 2017), special schools (six more), pupil referral units (one more) and independent schools (23 more).
However, there are 20 fewer primary schools open this year than last year.
The number of all-through schools also increased from 150 to 163.
5. Minority-ethnic pupils make up a third of primary children
In primary schools, 33 per cent of pupils of school age are of minority ethnic origins, an increase from 32 per cent in January 2017.
In secondary schools, 30 per cent of pupils are of minority-ethnic origins, an increase from 29 per cent in 2017.
The largest ethnic group is white British, followed by Asian, white non-British and black.
There has also been a 0.6-point rise in the number of primary school pupils exposed to a language other than English at home, to 21 per cent of pupils. The figure has been steadily rising since 2006.
In secondary schools, 17 per cent of pupils are exposed to a non-English language at home. This rate has also increased by 0.4 points.
The rise in pupil numbers with an additional language is largely driven by increases in the birth rate, rather than direct current immigration, according to the report.


Your thoughts