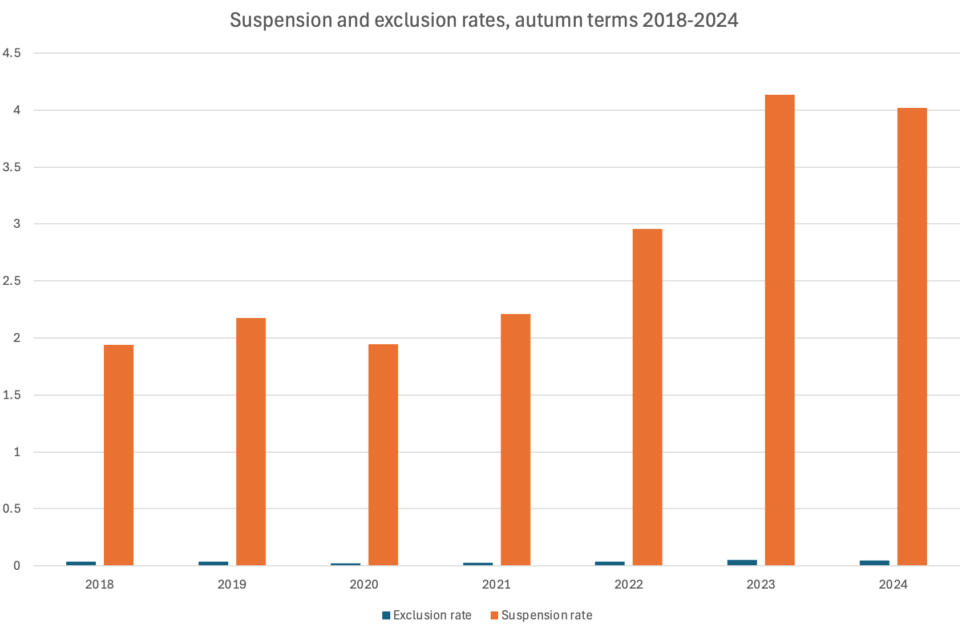
Rates of suspension fell last autumn for the first time since Covid lockdowns, but remain far above those seen before the pandemic, new government data shows.
And exclusion rates have returned to pre-pandemic levels after a rise seen in autumn 2023.
While the data published today is for the 2024-25 Autumn term only, it suggests the trend of rising numbers since Covid may now have peaked and be starting to fall again.
The Department for Education data shows a suspension rate of 4.02 per hundred pupils was recorded last autumn, down from 4.13 in autumn 2023, but still higher than the 2.96 recorded in 2022 and the 2.17 recorded in 2019.
The decrease has been driven by a fall in suspensions in secondary schools and special schools, despite a slight rise in the suspension rate in primary.
The rate of pupils suspended at least once decreased from 2.05 in 2023 to 1.98 last year.
The DfE said this was equivalent to a 4 per cent decrease in the number of pupils suspended at least once, from 171,800 to 165,600.
The permanent exclusion rate was 0.04 per hundred pupils last autumn, down from 0.05 in autumn 2023 and the same as in autumn 2022.
Broken down by school phase, the exclusion rate in primary schools remained unchanged, while there was a slight fall in the secondary rate and slight rise in special schools.

Unlike suspensions, exclusion rates overall are now the same as they were in the autumn terms of 2018 and 2019.
The DfE said persistent disruptive behaviour accounted for 51 per cent of all reasons given for suspension and for 38 per cent of reasons for permanent exclusions.
Government data is also broken down by region. The north east continued to have the highest suspension (6.66) and exclusion rates (0.08). However, the DfE noted both rates had fallen since autumn 2023.
The department said permanent exclusions had “decreased or remained the same in all regions except the east of England. London continues to have the lowest suspension rate of 1.8, while the capital and south east have the lowest exclusion rate – 0.02.
There remains a big divide between some groups of pupils. Those eligible for free school meals had a suspension rate almost four times that of non-eligible pupils (9.73 vs 2.11), and had an exclusion rate six times higher (0.12 vs 0.02).
The suspension rate for pupils with an EHCP (10.31) or receiving SEN support (11.09) remains much higher than those without identified SEN (2.46).
This is the same for exclusions. The rate was 0.11 for those with an EHCP, 0.14 for those with SEN support and just 0.02 for those without identified SEN.


Your thoughts