A-level results are out this morning – here’s your usual handy Schools Week round up of the key trends.
All the findings are for pupils in England, unless stated. Here’s what we know…
1. Overall performance in England
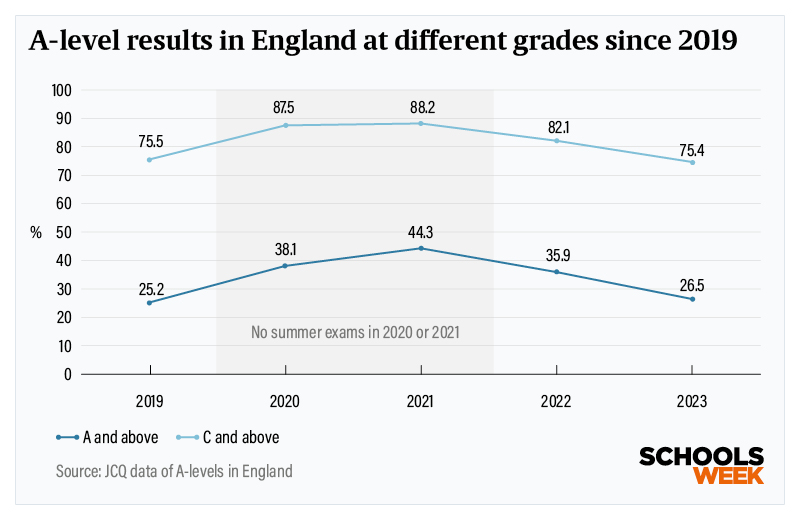
The proportion of A* and A grades has dropped from 35.9 per cent last year to 26.5 per cent as grading standards return to pre-pandemic standards, a fall of just over 26 per cent.
However, this is still slightly above the 25.2 per cent in 2019.
This year, 75.4 per cent of grades were C and above, down on 82.1 per cent last year and slightly below 75.5 per cent in 2019.
The number of students achieving 3 A* grades has dropped by more than half this year – from 8,570 to 3,820.
It’s still above pre-pandemic 2019 – when 2,785 pupils achieved it – but way down on the 12,975 pupils achieving 3 A*s in 2021, when teacher grades were awarded.
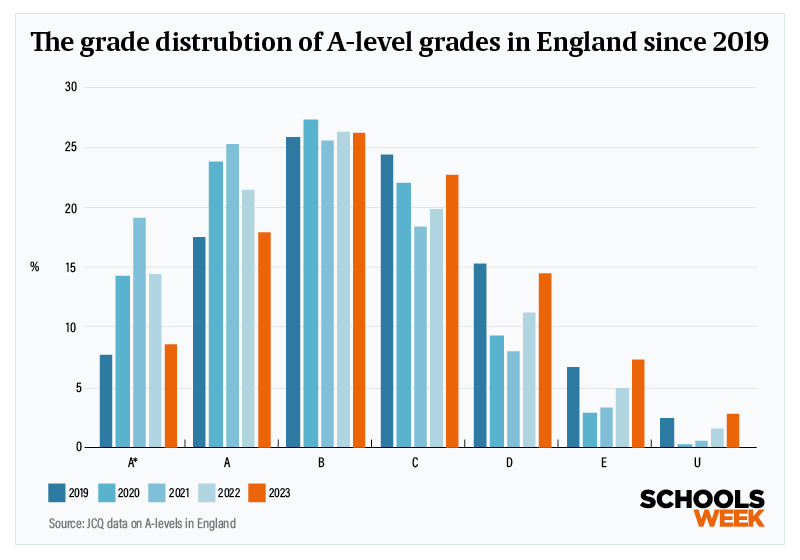
2. A-level grade distribution: 2019 to 2023
3. Regional attainment gap widens
While grading has mostly returned to pre-pandemic standards at a national level, the regional picture has changed, possibly signalling the impact of covid on children regionally.
In 2019, 23 per cent of grades in the north east were A and above, but this is now 22 per cent – meaning the region is now the lowest attaining in the country.
Whereas in London, 30 per cent were top grades this year compared to 26.9 per cent in 2019.
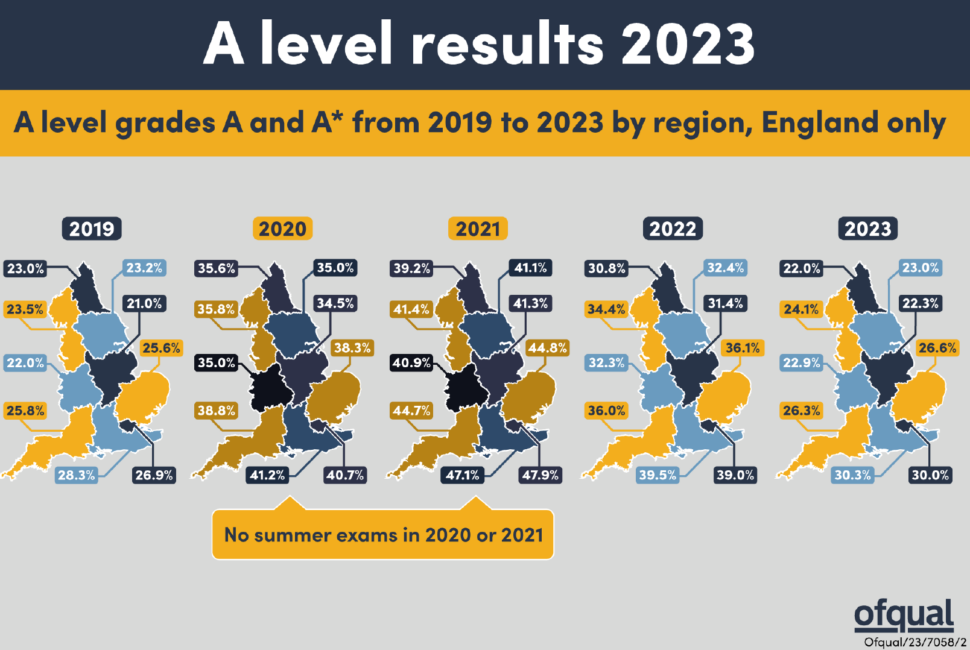
This means the gap between the regions has widened from 3.9 percentage points to 8 percentage points.
The north east and Yorkshire and Humber were the only regions to record below-2019 rates in top grades achieved.
4. Big fall in top grades for secondary moderns, FE colleges
According to data published by Ofqual today, further education establishments and secondary moderns saw the biggest fall in top grades between 2022 and 2023.
The proportion of A and A*s issued to pupils of secondary moderns, which are non-selective schools in areas with grammar schools, fell from 27.6 per cent to 19.1 per cent, (a decrease of 30.8 per cent).
The smallest falls were for private schools (18.3 per cent), free schools (20.9 per cent) and grammar schools (23.5 per cent).
However, top grades across all institutions apart from FE establisments remain higher than in pre-pandemic 2019.
The proprotion of top grades issued to comprehensive school pupils is 9.5 per cent higher than in 2019, and 5.8 per cent higher for both academies and private schools.
5. Economics rise, but Auf Wiedersehen German
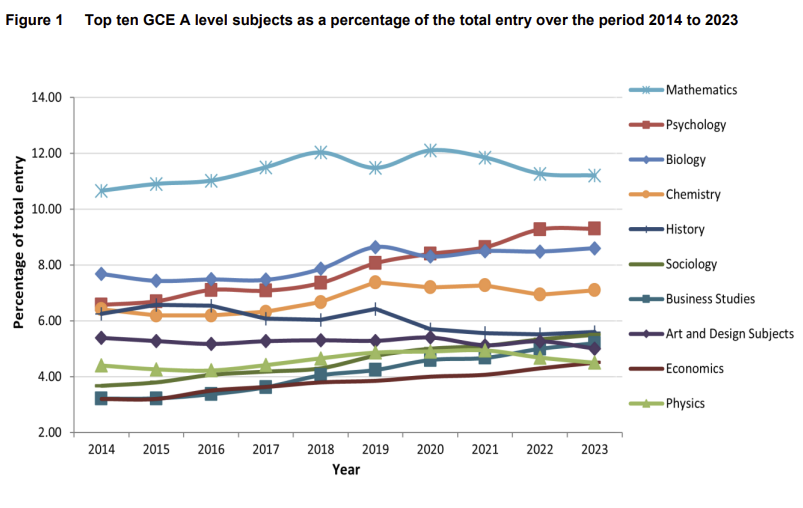
Across the UK, there has been no change to the top five most popular subjects. However, economics has taken geography’s spot in the top 10 most popular subjects after a 7.3 per cent rise in entries.
Computing entries grew the most of any subject – 16.7 per cent – from 15,693 in 2022, to 18,306 this year.
At the other end, German saw the largest drop in entries from 2,803 last year to 2,358 this year (15.9 per cent fall).
French and Spanish entries also both fell by just under 11 per cent.
6. Which subjects have the biggest gap between entries?
Computing continues to have far more entries from boys, who make up more than one in eight entrants.
Physics, further maths, economics, design and technology and ICT also all continue to be far more popular among boys than girls.
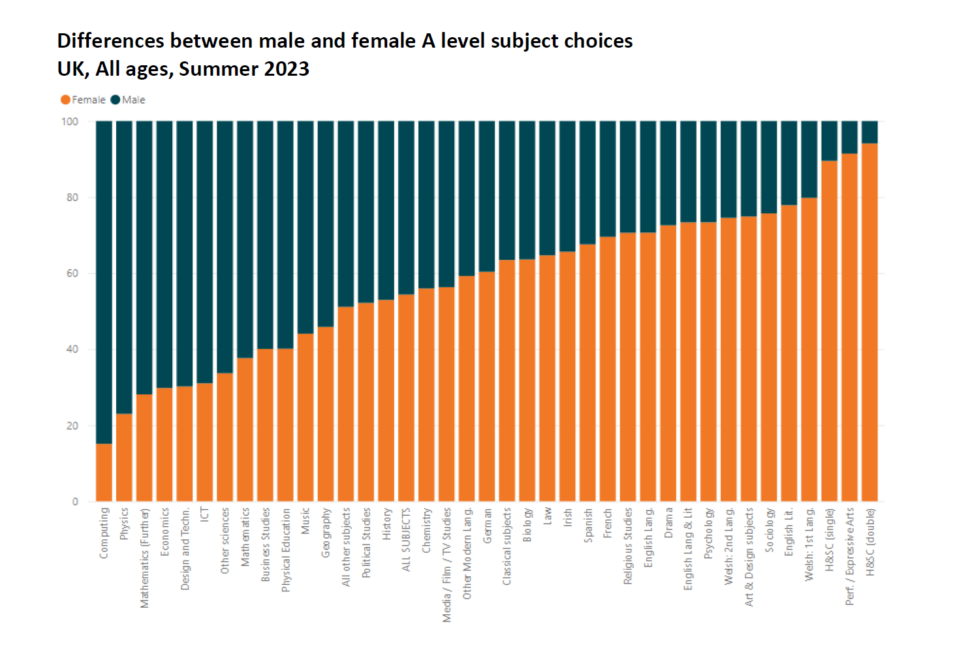
At the other end of the scale performing arts, English literature, sociology and art and design subjects continue to be far more popular with girls than boys.
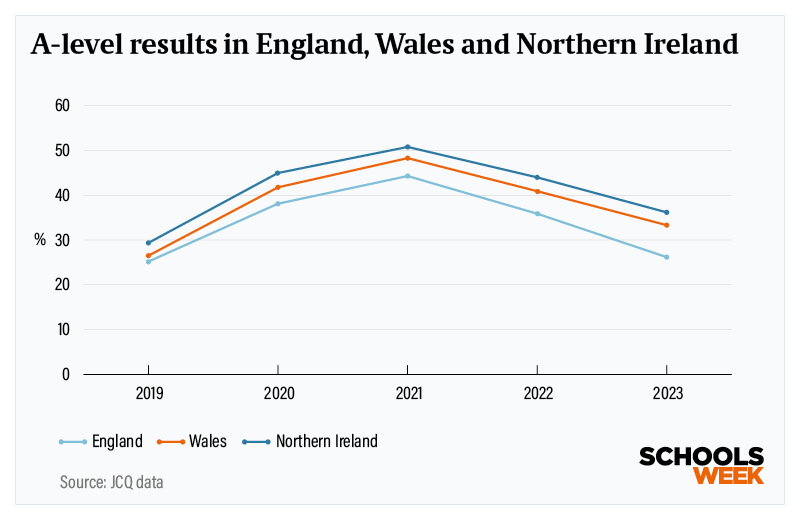
7. England falls behind in UK grade gap
While England’s grades returned to pre-pandemic standards this year, Wales and Northern Ireland are waiting until 2024. This means their grading is more generous this year.
The proportion of top grades awarded in England is this year 7.5 percentage points behind Wales (34 per cent) and 11 percentage points behind Northern Ireland (37.5 per cent).
In 2019, we were 1.3 percentage points behind Wales and 4.2 percentage points behind Northern Ireland.
Top grades in Wales and NI are 7.5 and 8.1 percentage points respectively higher than 2019 compared to just 1.3 percentage points in England.




Your thoughts