To see how your students have done in their A-levels compared to other students nationwide, Education Datalab has produced a handy set of graphs with accompanying analysis.
You can explore trends in national entry and attainment data between 2014 and 2018, for each subject, and overall.
Here are the tables for all subjects combined. You can click through to individuals subjects below.
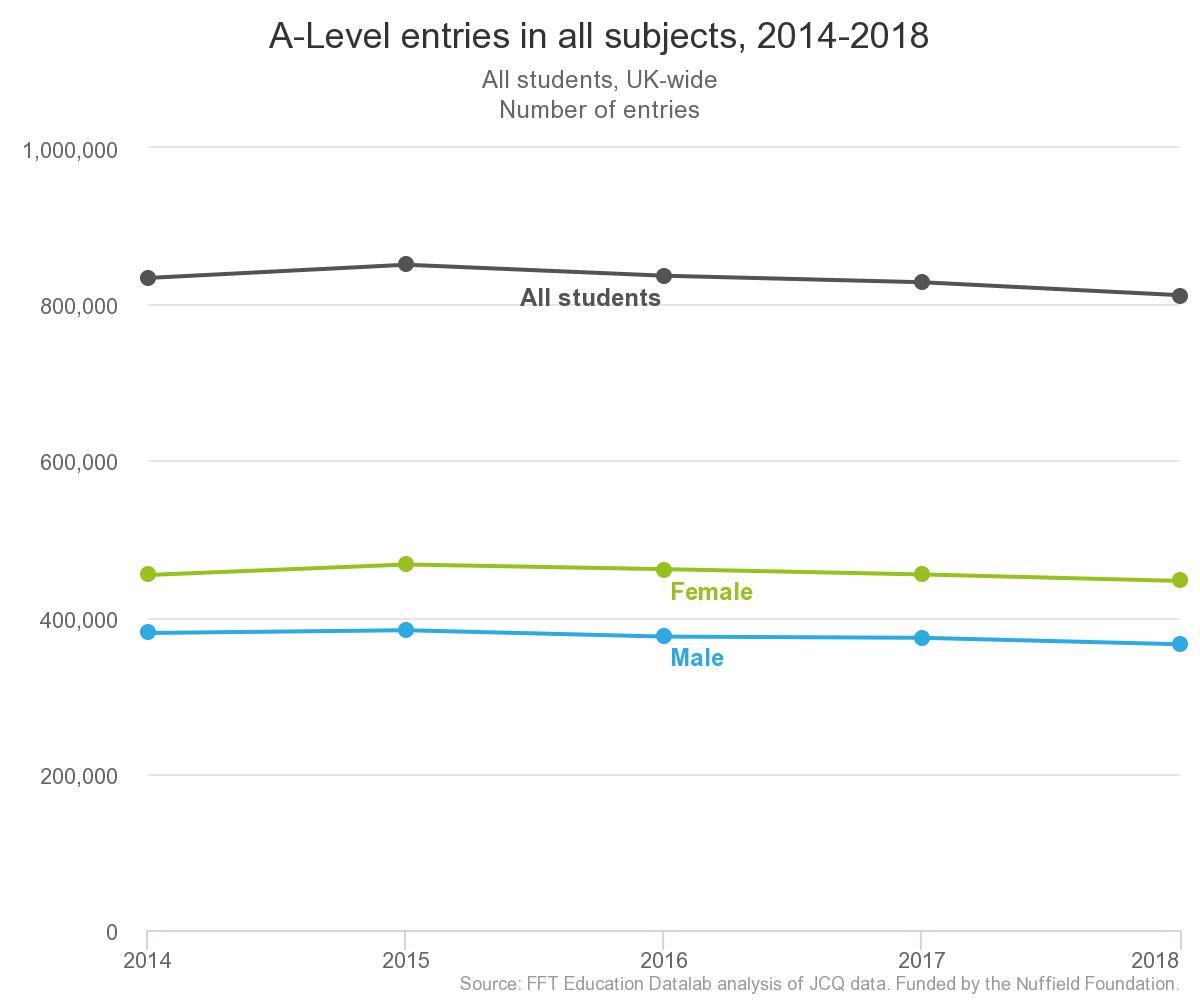
A-level entries: all subjects, UK-wide
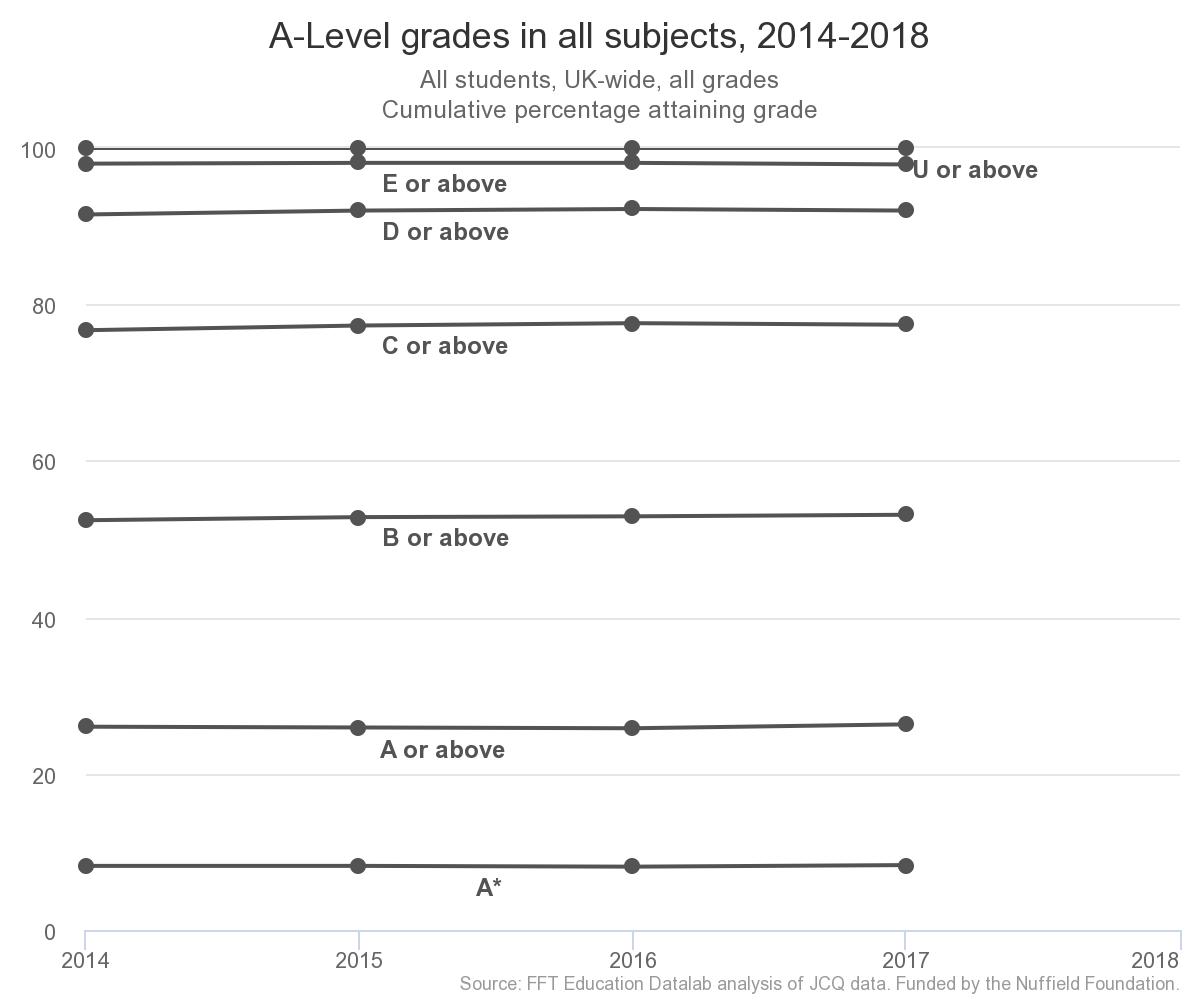
A-level grades: all subjects, UK-wide
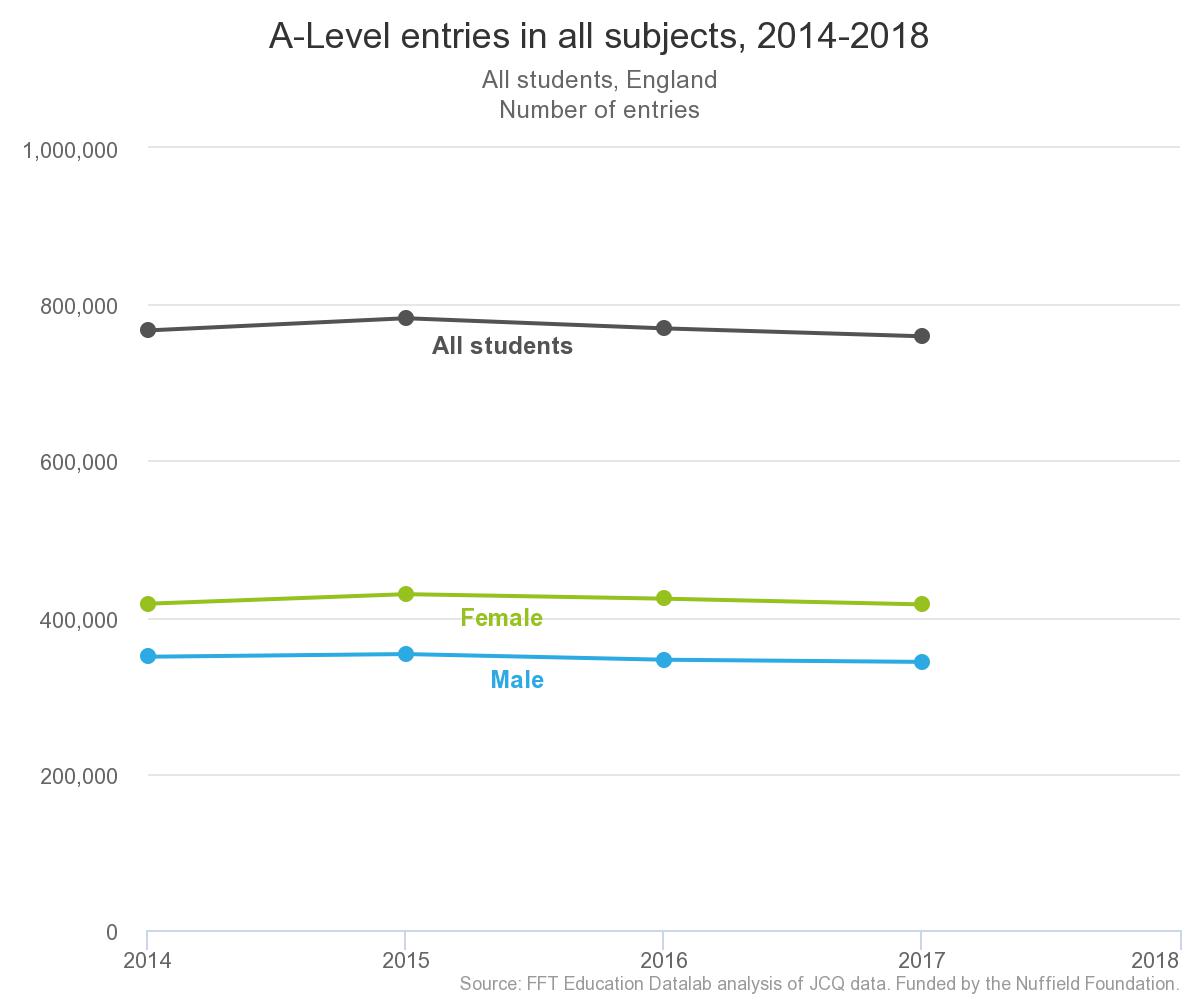
A-level entries: all subjects, England
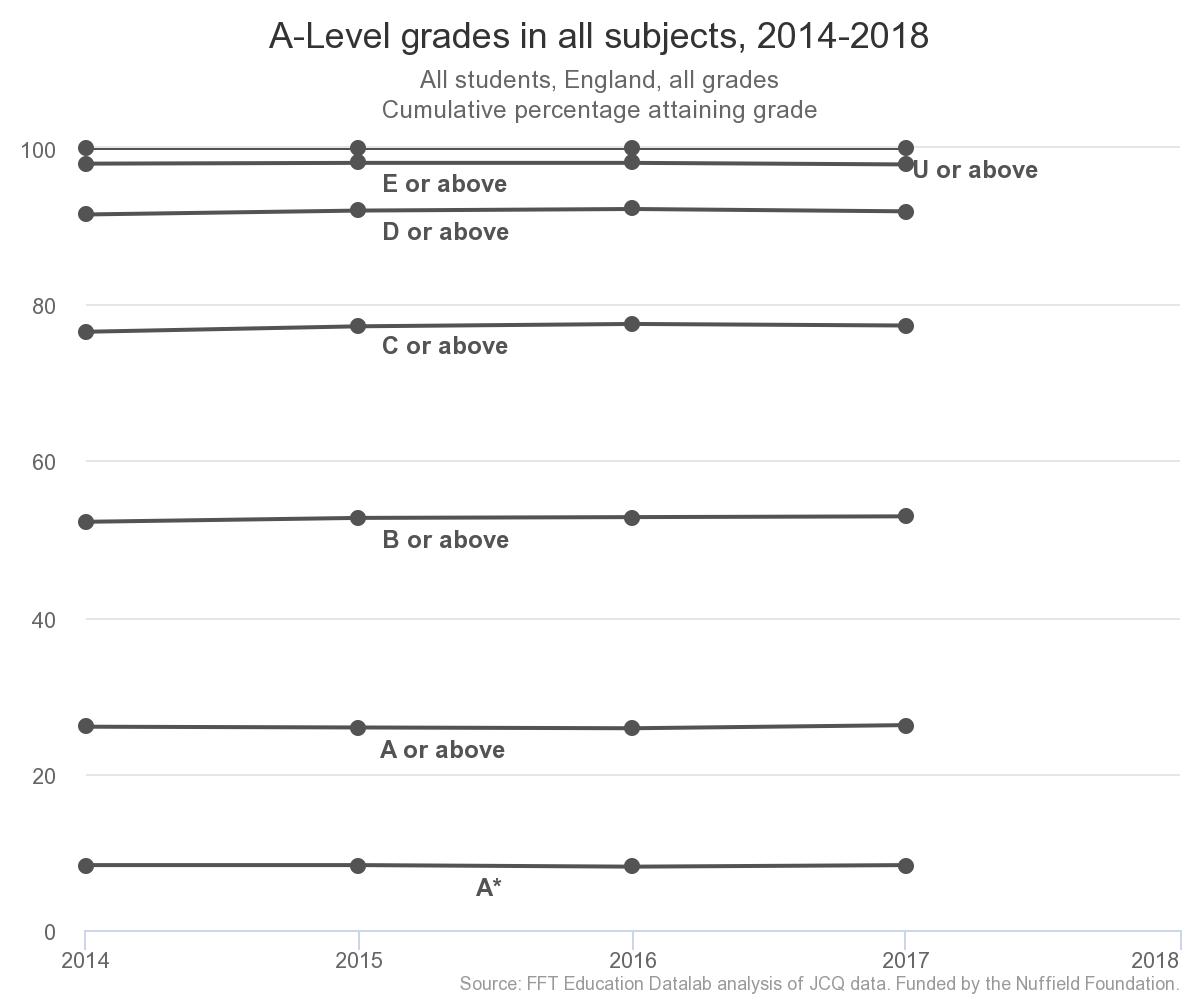
A-level entries: all subjects, England
A-level results 2018: subject tables
Art and design subjects
Biology
Business Studies
Chemistry
Classical subjects
Communication studies
Computing
Critical thinking
Design and technology
Drama
Economics
English literature
English language
French
General studies
Geography
German
History
ICT
Law
Mathematics
Further mathematics
Media/film/TV studies
Music
Performing/expressive arts
Physics
Political studies
Psychology
Religious studies
Sociology
Spanish
For our own analysis, you can read about the 5 key trends in England’s data, to find out which subjects are increasing or declining in popularity, which subjects male and female candidates do best in and which have the greatest gender gap.
You can also read our headline story on the slump in A* grades to the lowest level since 2013.


Your thoughts