GCSE performance tables are out today. We have put together our league tables highlighting the schools doing the best for disadvantaged pupils.
And here looked at how free schools are doing.
Below are some other things we learned from today’s publication.
1. The gap between disadvantaged pupils and their peers has increased
We are now, pretty much, back up to the same achievement gap as in 2013, after it decreasing for the last four years.
The Department for Education (DfE) says this is, in part, due to a change in the definition of “disadvantaged pupils”, which adds in about 1,000 pupils at the end of year 11. The new definition includes children who have been adopted and those who have been in looked after care for at least 1 day rather than six months.
Although the additional number is small the DfE said “The impact on attainment is larger due to the presence of some of the lowest performing pupil groups.”
2. No one knows how many schools are “failing”
In a press release sent to journalists yesterday, the DfE said that 312 schools did not meet the “floor target” (40 per cent of pupils achieving five A*-C GCSES, including English and maths, and the school is below average for pupils’ progress in English and maths).
This was reported by many national media outlets as a “fall” from last year, when there were 330.
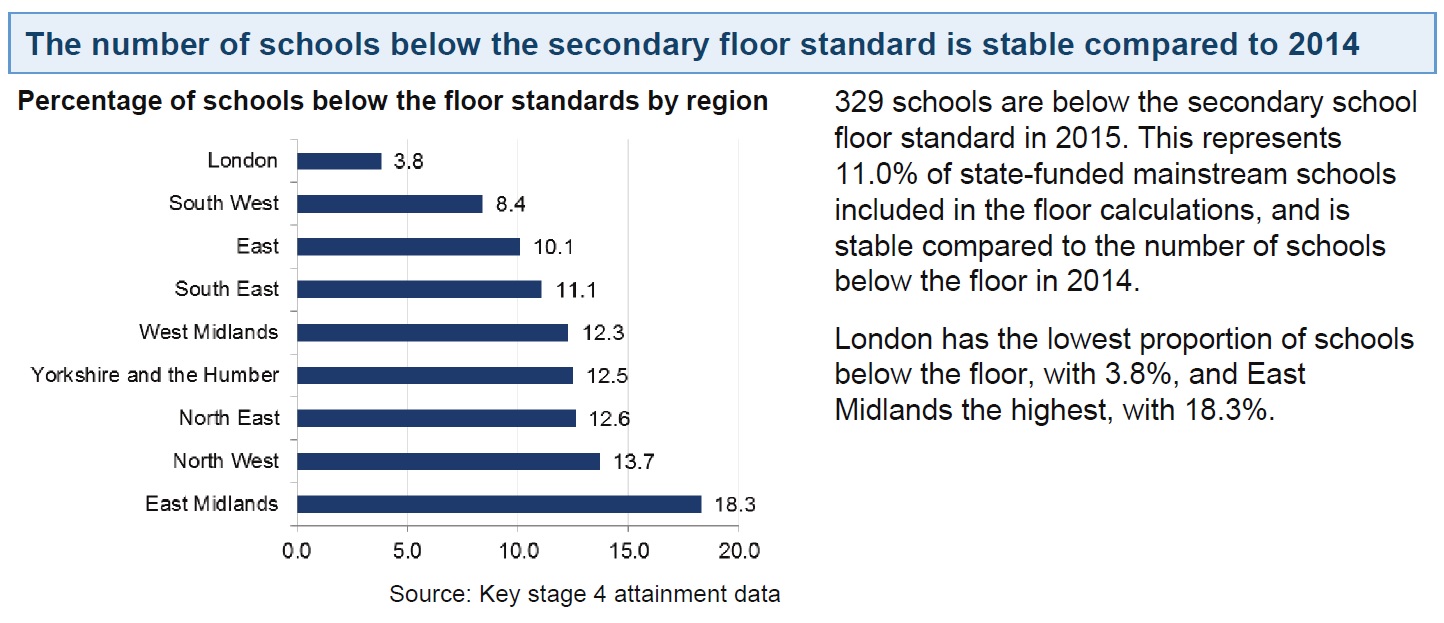
However, the DfE’s own statistical release (below) says there are 329 schools below the floor target. So no change at all really.
Yet, when we analysed the DfE’s data using the government-prescribed criteria for “failing”, we found 360 schools are under the floor target.
This includes all types of maintained schools – sponsored academies, converter academies, community schools, free schools, foundation schools, voluntary aided and controlled schools, and UTCs.
Confused? Yup. Us too.
3. After five years, sponsored academy results stagnate
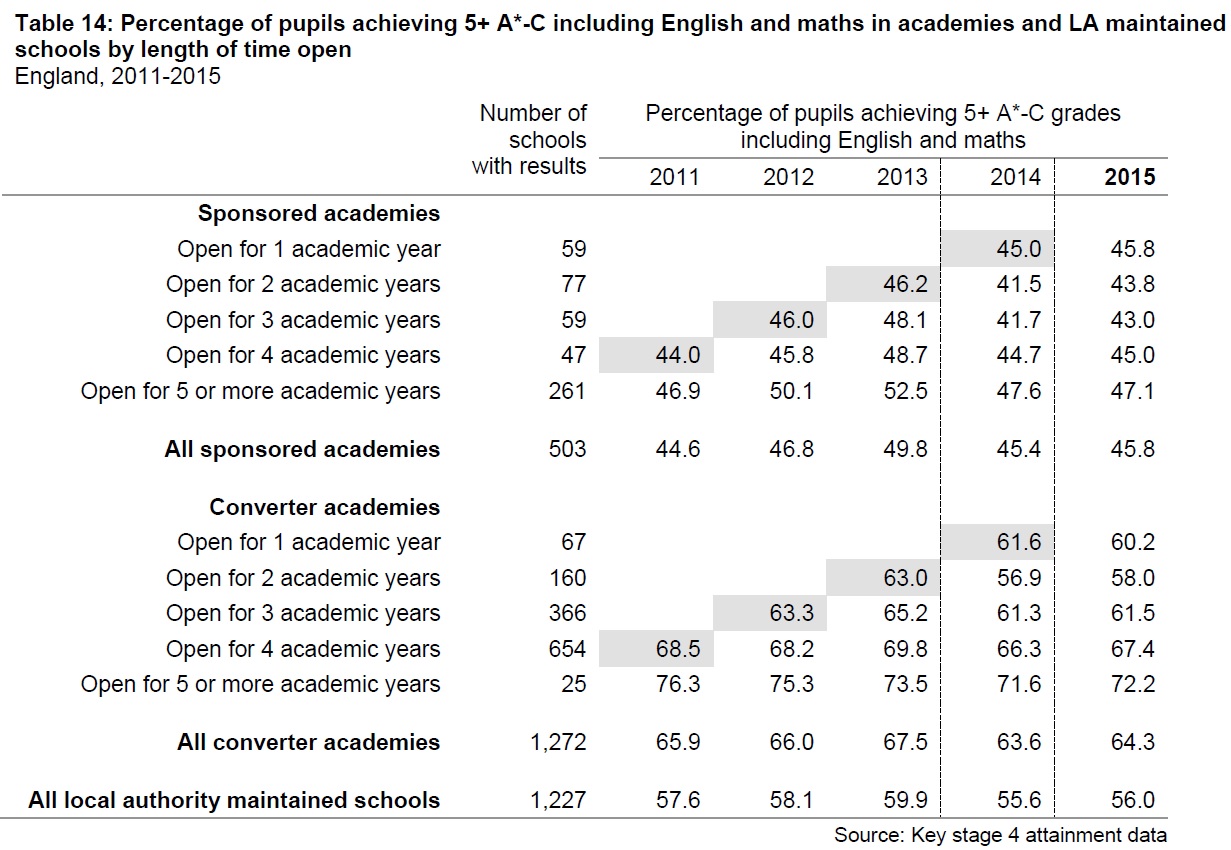
Something the DfE press release didn’t point out: schools that have been sponsored for more than five years have seen their results drop.
Sponsors are brought into schools to “turn them around”. And, as the DfE pointed out in its press release, should “transform the fortunes of pupils”.
After two years, the DfE rightly says schools with sponsors have improved their results by 2.3 percentage points compared to last year.
But, what the DfE didn’t say is that while this is an increase, it’s one of the lowest results for school type and only just scrapes the floor target.
They also didn’t mention that this year the results of schools with long-term sponsors (five years or more) results fell. And schools with sponsors for three years have the lowest results (43 per cent). See below for the full table.
Converter academies, typically outstanding at the time of conversion, are the best performing type of school. But they are high-performing to begin with.
4. The national average has been revised and increased by 1 percentage point
In the government’s provisional data, released in October, the national average for GCSEs was said to be 56.1 per cent.
Today, that figure has been bumped up to 57.1 per cent.
So this means on GCSE results day last year the government could tell the public it had arrested the increase in exam grades (“no more dumbing down”), but today – based on this higher rate – can still claim more schools are successful than last year. They get to look like they are limiting grades but also improving schools. A clever trick.
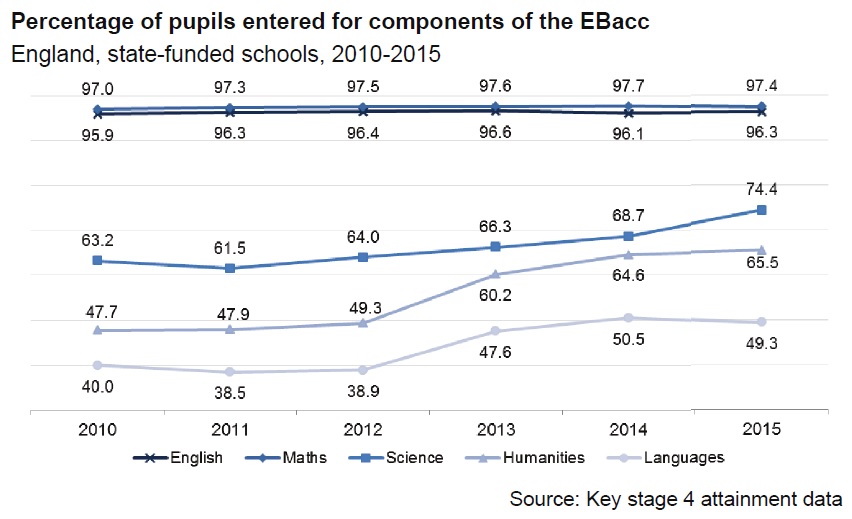
5. EBacc entries to science and humanities has increased, but languages has decreased
Is this the forewarned lack of modern foreign language teachers starting to show its impact?
And remember, this is the last year the 40 per cent floor target will be used. Next year will all be about Progress 8
But it’s hard to tell exactly what its impact will be as only 327 schools chose to opt in early (that’s just 10 per cent). Of those 17 did not meet the new “floor” of -0.5.
And a quick check of the types of schools that did opt in shows that almost 90 per cent were above the current floor standard.
**UPDATE: The DfE has got in touch. It says the 312 figure mentioned its press release is of schools below the current floor standard, and 329 is achieved if you add the 17 schools under the Progress 8 meaure (even though this isn’t the current floor standard).


Why place so much credence on such “dodgy” data ?
I think the floor standards discrepancy is that 312 schools were below the 40% 5 A*-C floor standard, while 17 of the schools that opted into Progress 8 early fell below the ‘new’ floor standard for that measure. So altogether, 329 schools were below a floor standard of some description.