On December 18, Schools Week showed the huge drop in inspections in the autumn term compared with 2014 (585 compared with 1,642). Sophie Scott now looks at the outcomes of those inspections, comparing them with the same term in 2014
Overall grade distribution
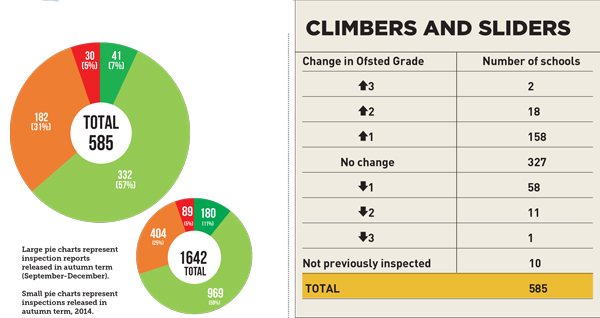
Fewer schools were rated good or outstanding last autumn compared with autumn 2014 (64 per cent in 2015; 70 per cent the year before). This can be attributed to a higher proportion (31 per cent) being told they required improvement.
Last term, a higher proportion of schools moved up at least one grade (30 per cent compared with 26 per cent). Most (56 per cent) remained at the same grade.
Ofsted made far fewer first inspections – in autumn last year just 2 per cent of visits were to schools “not previously inspected”, compared with 14 per cent in 2014.
![]()

Primaries VS Secondaries
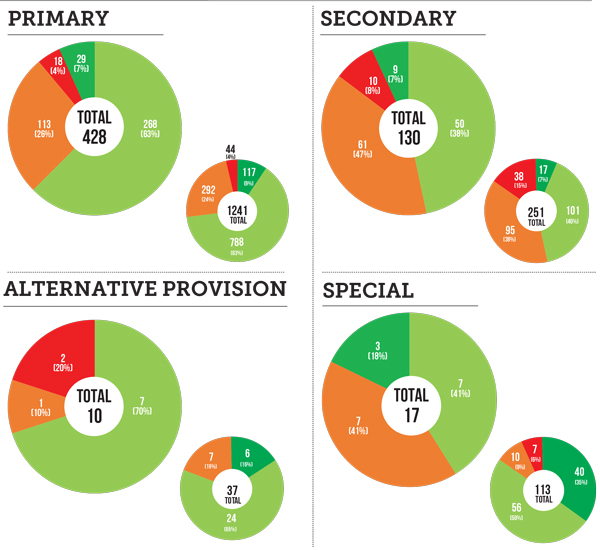
Primaries, as usual, outperformed secondary schools, although slightly fewer received the top two Ofsted grades – good and outstanding – than in the same period in 2014 (70 per cent compared with 72 per cent).
Secondary schools lagged behind in the proportion gaining the top grades, with 45 per cent receiving a good or outstanding rating, 2 per cent down on 2014.
But secondaries are improving. The figures show 34 per cent of those inspected improved their Ofsted rating by at least one grade, compared with 30 per cent of primary schools. A small, but important, change.
Alternative provision and special schools dipped in performance.
No special school was rated inadequate, but 41 per cent were told they required improvement, up from 9 per cent in 2014 (although the drop in the number of inspections means fewer schools were visited).
No alternative provision school was rated as outstanding. Seven of the ten inspected were told they were good. In 2014, no school was rated as inadequate, whereas this term two were given the lowest rating.

Different school types
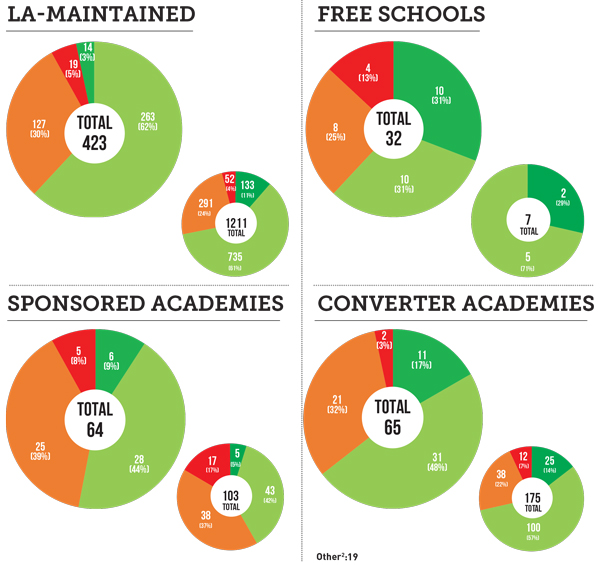
Many more free schools are now inspected. In autumn 2014, just seven were inspected over the term. In autumn last year, 32 were visited. The picture in 2014 was positive – all schools were good or outstanding. But last year, 38 per cent of free schools were rated either inadequate or requires improvement.
But, equally, 31 per cent were told they were good or outstanding.
Local authority (LA)-maintained schools and converter academies were equal in the proportion getting the top two grades – 65 per cent. This is a drop on 2014 (72 per cent), although more converter academies were outstanding, proportionally, than their LA counterparts.
Sponsored academies did better last year. Overall, 53 per cent were either good or outstanding, compared with 47 per cent in 2014. And just 8 per cent were inadequate, compared with 17 per cent in 2014.
The proportion of converter academies told they required improvement increased last term, with 32 per cent of inspections resulting in a grade 3. Twenty-two per cent were given this rating in 2014.
What is interesting, again, is how these different school types compare in terms of improvement. LA-maintained schools improved more than their academy counterparts – 36 per cent of the LA schools inspected went up at least one grade. This compares with 17 per cent of all types of academies.

Notes:
Based on all section 5 school inspection reports published between September 1 and December 10, 2015
Data provided by Watchsted, a service from Angel Solutions Ltd
Percentages may not sum to 100 due to rounding


Your thoughts