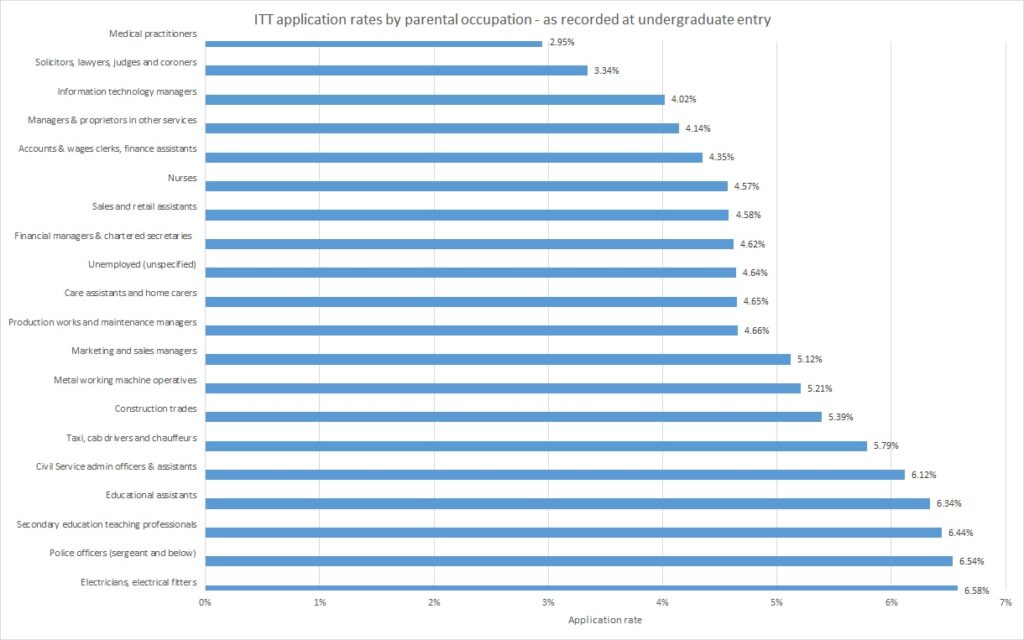
Children of police officers, electricians and teachers are the most likely to train to become teachers – while people whose parents are judges, medical professionals and lawyers are the least likely, according to new data from UCAS released today.
It is the second year the admissions service has provided detailed analysis which reveals the varying background, gender and ethnicity of initial teacher training (ITT) applicants. Today’s release covers applicants from the 2014-15 cycle, who started their courses in September 2015.
UCAS linked applicants’ data with information they provided when they first entered the UCAS system as undergraduates to pick out the trends.
Here are the report’s key findings:
1. What your parents did affects whether you want to become a teacher
University graduates whose parents were electricians, police officers, secondary teachers or educational assistants are at least twice as likely to apply to ITT courses than those whose parents worked as medical practitioners (such as GPs), solicitors, lawyers, judges and coroners when they began their first degree.
This is based on what applicants said was their highest earning parent’s occupation when they applied for an undergraduate course – so, for the majority of 2015’s ITT cohort, this would reflect the jobs of their parents in 2011.
Below is a full breakdown of the top 20 most common professions of parents and application rate for the 2015 cycle.
It is worth noting the UCAS figures don’t include the Teach First cohort, which has targeted graduates from top universities, and could include those more likely to have parents from the law or medical professions, or similar.
2. Graduates from poorer backgrounds are more likely to apply to become teachers
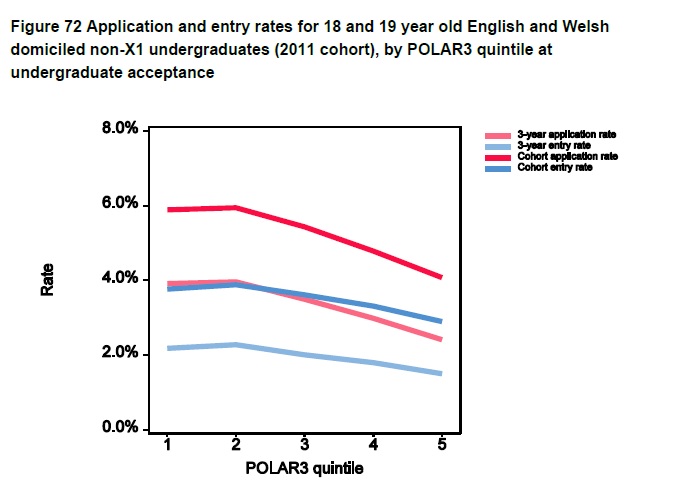
UCAS uses POLAR3 quintiles to assess disadvantage of students – this is an assessment used by HEFCE based on higher education participation rates in a local area.
The quintiles range from 1 (most disadvantaged) to 5 (most advantaged).
The graph below shows that 6 per cent of the most disadvantaged (quintile 1) students apply to ITT courses compared with just 4 per cent of those in the most advantaged group (quintile 5).
When it comes to acceptance rates though, graduates from the top quintile (5) are more likely to get a place (68 per cent) compared with 62 per cent in applicants from quintile 1.
So, the inequality that exists in undergraduate profiles (where there is still a large gap between the number of students from the most advantaged and least advantaged backgrounds entering university) is not offset by the higher proportion of disadvantaged students applying to become teachers.
3. More than half of people accepted to ITT courses had A-level grades of ‘CBB’ or less
While 51 per cent of applicants had received A-level grades of CBB at the most, the UCAS data shows applicants with higher A-level results were more likely to get accepted than those with lower A-levels.
The data doesn’t show acceptance rates by degree class – but Department for Education data shows that 75 per cent of ITT entrants in the same year achieved at least a 2:1 in their degree.
Today’s figures also show that one in every 35 undergraduates will enter ITT courses soon after graduating.
4. 1 in 10 maths graduates apply to be a teacher
This is one of the highest entry rates to ITT courses by undergraduate degree route, but still doesn’t fill the need for maths teachers, filling only 93 per cent of places this year. (The data also doesn’t show that all of these trained as secondary maths teachers, they could have done other subjects or trained in primary).
A quarter of people who studied an undergraduate degree in “education” applied to ITT courses, followed by a rate of 11.2 per cent of linguistics graduates. Only 1.7 per cent of computer science graduates applied to ITT courses.
5. White applicants were twice as likely to be offered a place than black applicants
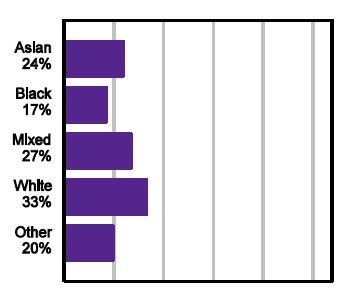
A third of choices from white applicants (33 per cent) were offered a place on an ITT course – the highest rate of any ethnicity.
But just 17 per cent of black applicants were offered a place.
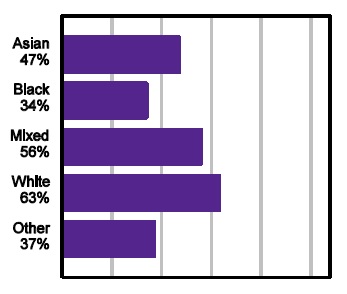
And, of those who accepted these places, this disparity continued. Two thirds of white applicants were placed, while just a third of black applicants were.
UCAS says the disparity between ethnic groups is based on a number of factors, including: location, qualifications held, and likelihood of applying to different training routes (university- or school-led).
6. It was easier to get a place on an ITT course in 2015 than 2014
There were six per cent fewer applications made to ITT courses in 2015 (47,100) compared with 50,300 in 2014.
This drop in application rate was attributed to the dip in numbers studying at university in 2012 – when there were 17 per cent fewer starts, put down to the increase in tuition fees.
Despite there being fewer people to choose from, there was an increase of 7 per cent in the number of acceptances.
7. For every man on an ITT course, there are two women
About 19,000 women were placed on an ITT route, compared with 8,775 men. This ratio is broadly similar to the number of applicants by gender.
Save
Save
Save


Your thoughts