Schools are proposing results for their pupils that are nearly a full grade higher in some subjects than those achieved last year, a new study has suggested.
Analysis by Education Datalab found that preliminary teacher-assessed grades put together by schools for this year’s new grading system were on average between 0.3 and 0.6 higher than actual results in previous years.
Grades issued for computer science were on average almost a full grade higher.
Over the past two weeks, schools have been submitting their teacher-assessed grades and rank order of pupils to exam boards, which will moderate the results before they are issued to pupils in August. Exams were cancelled this year due to coronavirus.
Datalab ran a statistical moderation service that allowed schools to submit their proposed preliminary centre assessment grades, which they could then compare to historical attainment.
It meant the analysts had data from more than 1,900 schools to explore. However, there are some caveats worth highlighting.
Datalab doesn’t know if schools will have submitted the same grades to exam boards – as they might have tweaked the grades using the extra information provided by Datalab.
While it looks like more than half of schools did change their grades (some schools submitted grades to Datalab more than once), the change was relatively small – on average just 0.1 of a grade reduction.
It’s also worth reiterating that the teacher-assessed grades will be moderated by exam boards and Ofqual before a final grade is issued to pupils. The regulator has already warned that those final grades will ‘more often differ from those submitted’ by teachers.
Here’s what they found.
1. Teachers are around half a grade more generous…
Datalab emphasised the task faced by schools and teachers to produce these grades, with “little guidance”, has been “enormous”.
They found that, in every subject analysed, the average teacher-assessed grade for this year was higher than the actual grades achieved last year.
In most subjects the difference was between 0.3 and 0.6. Computer science had nearly a full grade difference: 5.4 for this year compared to an average grade of 4.5 in 2019.
Of the 24 subjects looked-at, 10 had a difference of half a grade or more. Meanwhile, the smallest differences (around a third of a grade or less) were in English literature, combined science, religious studies and maths.
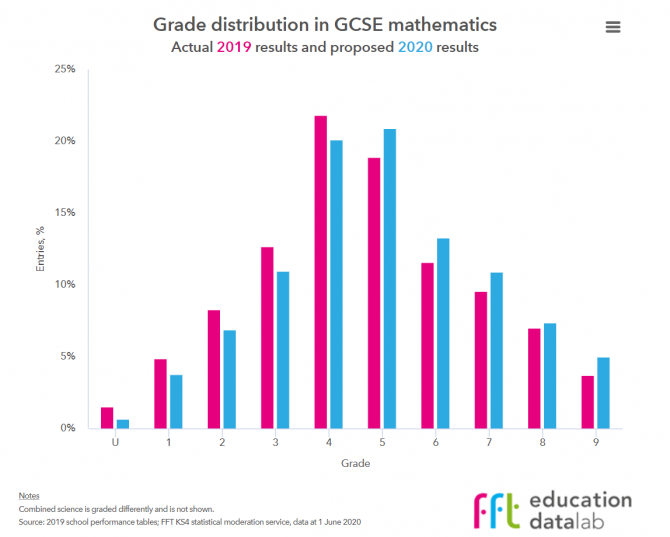
In maths, despite the subject having one of the smallest increases, the difference still means the share of pupils awarded a 4 or above would increase pretty substantially from 72.5 per cent up to 77. 6 per cent.
Across all subjects, if these grades were awarded, the number of grade 9s would increase from 4.8 per cent to 6.3 per cent. Grade 7s would rise from 23.4 per cent to 28.2 per cent, while those achieving a 4 would jump nearly 8 percentage points from 72.8 per cent to 80.7 per cent, Datalab found.
2. …but one reason for this could be the new GCSEs
Teachers were asked to submit the grade that they “believe the student would have received if exams had gone ahead”.
An important point that Datalab makes, that could explain some of the difference between teacher-assessed and actual grades achieved last year, is that many of the GCSEs are still relatively new. In some subjects, schools would have had just one year of past results to go on.
The report adds: “All other things being equal, you would expect the second cohort of pupils taking a qualification to do a bit better than last year’s, as teachers have an extra year of experience under their belts.
“An approach called comparable outcomes is normally applied to exam results to account for this, but that won’t have been factored in to the proposed grades that schools have come up with.”
3. So which subjects had the biggest boosts?
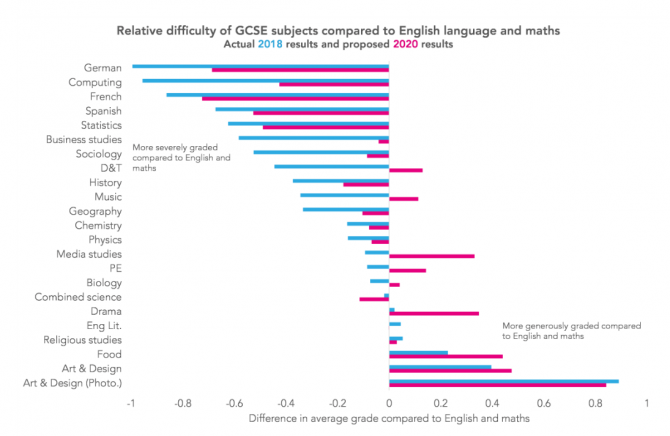
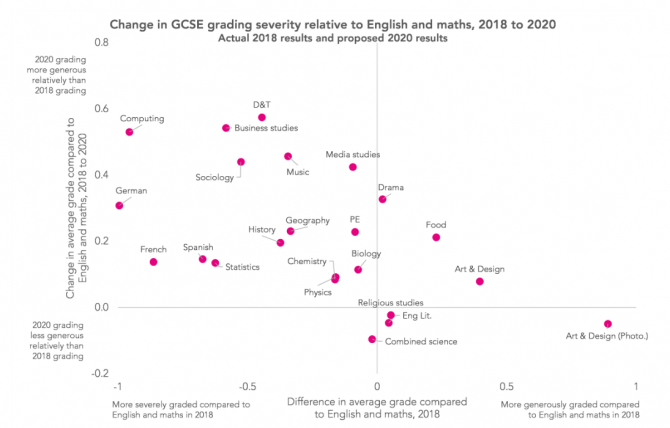
Datalab found that it tended to be the subjects historically marked more severely which saw the largest change between last year’s results and this year’s teacher-assessed grades.
While some subjects like computer science and modern foreign languages continued to be “harshly-graded” by teachers (when compared to English and maths), others such as music and design and technology were graded “less severely”.
But, when solely looking at the change in grading between 2018 and this year, the relationship between subjects usually graded more severely becomes clearer.
4. And what’s the potential effect on schools’ results?
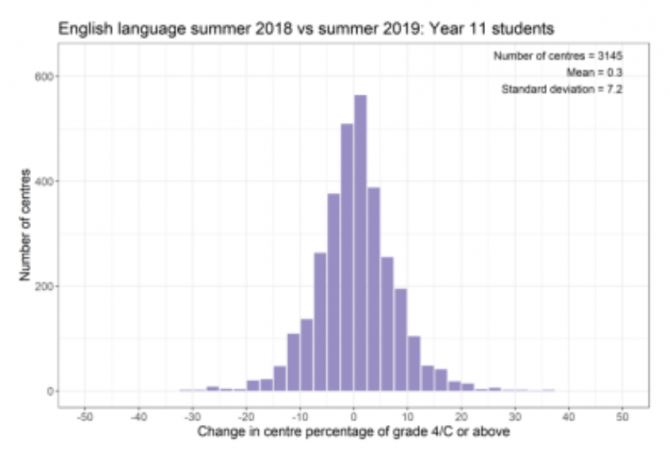
Ofqual’s annual centre variability charts show the number of schools that dropped or increased their results compared with the previous year.
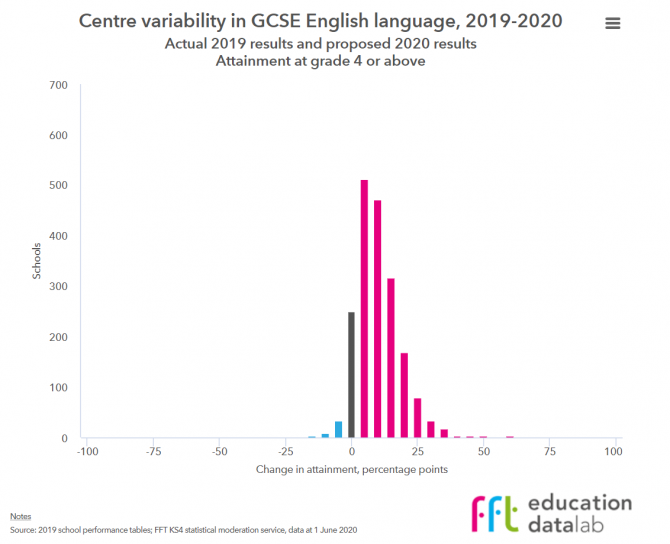
According to Datalab, they usually show a “symmetrical distribution around zero, with similar numbers of schools recording increases in a given subject as numbers recording decreases”. IE, this is last year’s table for English language:
But, Datalab’s study found in most subjects the changes were “skewed to the right” – most schools had increases in results, some as much as 75 percentage points. This is the Datalab table for English language this year:
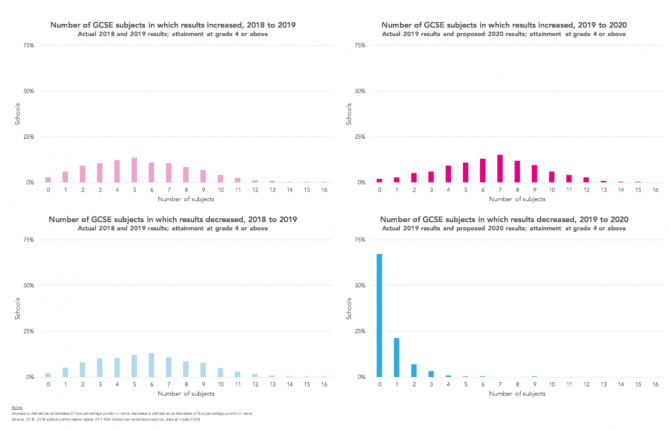
When comparing results between 2018 and 2019, Datalab found the most common (or modal) number of subjects where a school would see results increase was five.
Comparing the 2019 results to the 2020 teacher-assessed grades, that jumps to seven. (In 69 schools – of the 1,500 looked at for this part of the analysis – results increased for every subject!)
But, most importantly, the number of subjects where schools saw a decrease dropped massively.
When looking at 2018 to 2019 results, the number of subjects where schools had a decrease in results had a similar-ish spread to the positive (albeit the most common number of subjects decreasing was slightly higher at 6). But, when comparing 2019 to 2020, two-thirds of schools didn’t see a decrease in a single subject.
(The analysis included schools with more than 25 entries in a subject, and subjects with at least 100 schools entering them).
5. The exams regulator now has a ‘hugely complex’ task
So what happens now?
If these grades are similar to those submitted, Datalab said it’s likely that Ofqual and the exam boards will have to apply statistical moderation to bring them down.
But they add this will be a “hugely complex task, the likes of which have never been done before”.
“Without any objective evidence on the reliability of grading at each school, the most difficult part will be finding a way of doing this fairly for pupils in schools which submitted lower results, when some other schools will have submitted somewhat higher results,” the report added.
As well as the proposed grades, schools had to submit rank ordering of their pupils for every subject. Datalab said it also “seems likely that these will be used to shift some pupils down from one grade to the next”.






This is an interesting piece of statistics. Personally from my side , In Engineering under DT this years cohort were of a much higher ability compared to the previous year and us teachers were well prepared and ironed out all the teething problems compared to the previous year when the new specification was released.
This is an interesting piece of statistics. Personally from my side , In Engineering under DT this years cohort were of a much higher ability compared to the previous year and us teachers were well prepared and ironed out all the teething problems compared to the last year.
Surely there must be historic data comparing teachers predicted grades with exam grades for different past years. This will provide a robust assessment to indicate how well teachers can predict students exam results. The above analysis cannot be used to assess this.