GCSE results are out.
Each year Ofqual produce boring-sounding variability charts. They sound boring, but they show how many centres, (schools or colleges), dropped or increased their results compared with the previous year.
For example, if your school dropped 25 per cent in one subject, you can see how many other schools also had the same dip.
So, how normal are the changes in your GCSE scores this year?
Overall, the picture is one of remarkable stability. After several years of reform, things have calmed down. If your results have changed a lot (up or down), then you are unusual.
GCSE English: A picture of stability
DO NOT PANIC. The graphs look complicated, but they’re not.
The chart below shows how many ‘centres’ (schools or college) increased or decreased their 4+ grade rate this year.
The numbers on the bottom are the amount of change in each school’s results. If your results increased by 1 percentage point, then your school is represented in the first bar to the right of the 0 number on the bottom scale. That’s because each bar represents around 2.5 percentage points of change.
If your result dropped by 9.5 percentage points, then you are in the bar that’s fourth to the left of the 0 number on the bottom row. If you then look to see how high that bar goes, you will see that it’s around 165. Hence, we can say that along with your school, around 164 other schools/colleges also saw their results reduce by between 7.5 and 10 percentage points. If you saw a similar drop – then you’re not alone, but you are unusual.
Most centres only moved between -2.5 and 2.5 percentage points either way. And the most prevalent shift was up by between 0.1 and 2.5%
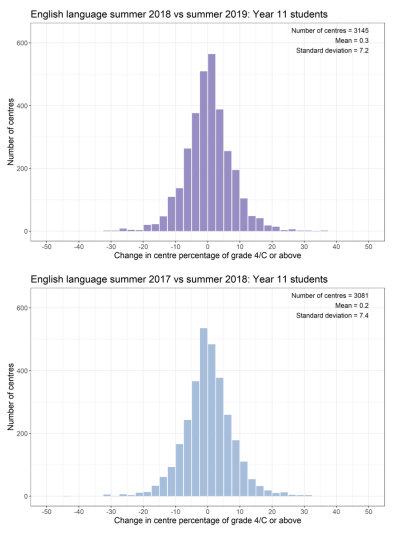
As you can see, there is a second graph below the first one. This graph tells us what the changes looked like last year.
To do this, we look at how similar the two graphs are. If they are very similar, it means there was not much change in the patterns between last year and this year. In English, we can see that things are very similar. Exams and cohorts this year were very similar to last year.
Finally, the height of the middle bars tells us how ‘stable’ most centres are. If the bars in the middle are the highest, and the profile looks like a big mountain peak, it tells us that most schools got very similar results to last year. If the graph seems flatter – more like a rolling hill – then it means schools suffered wild fluctuations.
In English Language, the profile is more like a mountain peak, which means stability. If your English results changed a lot this year, you are unusual.
English literature
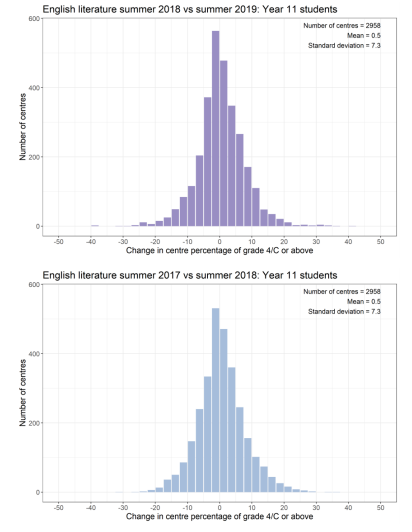
In English literature, we see the same trend. Very similar to last year and most centres only changing their results by a few percentage points.
GCSE Maths: No surprises
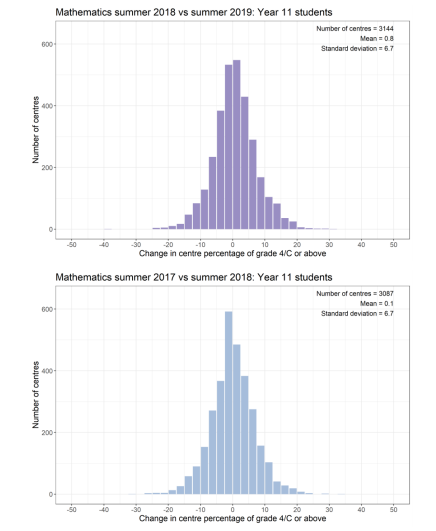
The average change this year was 0.8 percentage points – which is better than last year when it was 0%.
If your results increased or decreased by more than 10 percentage points you are in an elite club of about 450 schools.
GCSE Science: Triple
I’m not going to put all three of the triple science graphs out because it’s relatively static, with most centres moving an average of between 0.1 and 0.4 percentage points for each of the subjects. If you had a significant change, you’re an outlier.
If you want to see your particular science specialism, use the Ofqual analytics tool.
GCSE Science: Combined
Last year, the newly reformed GCSEs made for lots of change. The average percentage point change last year was 3.6, which is vast, and it was -2.2 the year before.
For once, the scientists can breathe a sigh of relief this year. Stability is back!
For combined science this year, the mean percentage point change was just 0.7. That said, there are some schools which registered drops of around 30 percentage points, and a few others that gained about 30 percentage points. They are rare, but it goes to show that science is still a volatile subject which can take a hit if something goes wrong with preparation for the exams (and, conversely, that gains can be quickly made back).

GCSE History
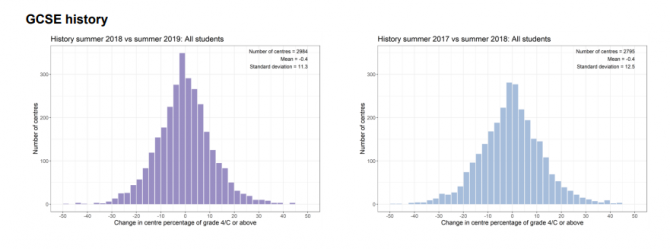
History continues its decline, with centres seeing their pass rates going down by 0.4 percentage points on average. That comes on top of a -0.4 decrease last year too.
A sensible guess is that as more pupils are forced into history to deal with the EBacc requirements, it is reducing the overall pass rate amongst the cohorts sitting the qualifications.
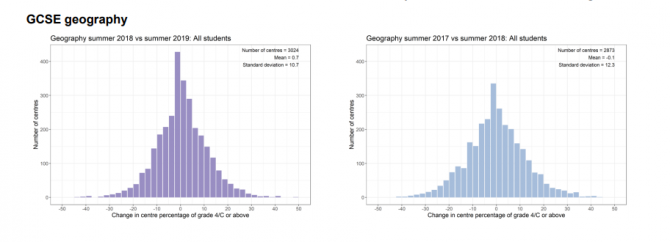
GCSE Geography
Geography, meanwhile, had a fairly successful year. The average centre went up by 0.7 percentage points, and the mountain peak became higher, suggesting more stability in results.
That said, there is quite a spread in the results changes, with around 400 schools getting changes of more than 15 percentage points in their grades (either way). And there are a small number (maybe 10-15) of schools which dropped more than 40 percentage points.
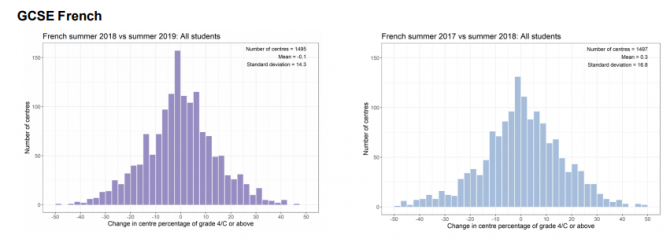
GCSE French
Finally, here’s the GCSE French numbers. Overall, the average score was down a tough by 0.1 percentage points. As ever, the spread is more extensive than in all other subjects – so if you see drops or gains of over 20 percentage points, that’s not as outlandish as it seems.
In conclusion?
One would expect the school’s English and maths results to be roughly the same as last year, science to be reasonably settled (unless you fiddled about with your entry profile), history and french to be down a touch, and geography to be up. If your results are much wilder than this, it’s probably due to fiddling about with entry profiles, or, in languages, it seems like things can be a bit wild sometimes!
To get even more accurate results that compare your context to others, you can get these charts on the Ofqual Analytics website and then add in, or take out, various factors to your heart’s delight. Enjoy.


Your thoughts