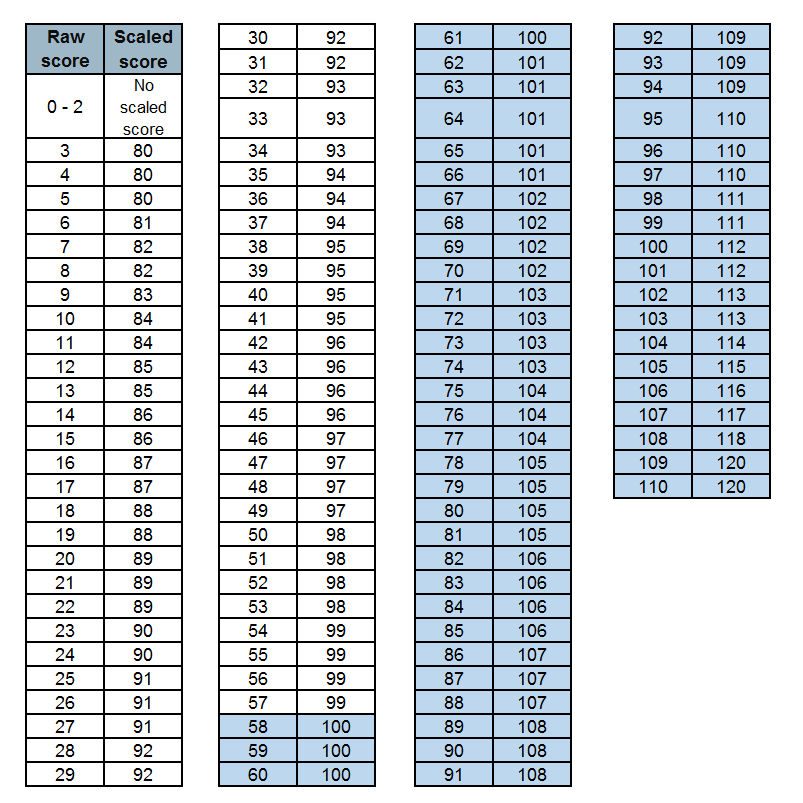
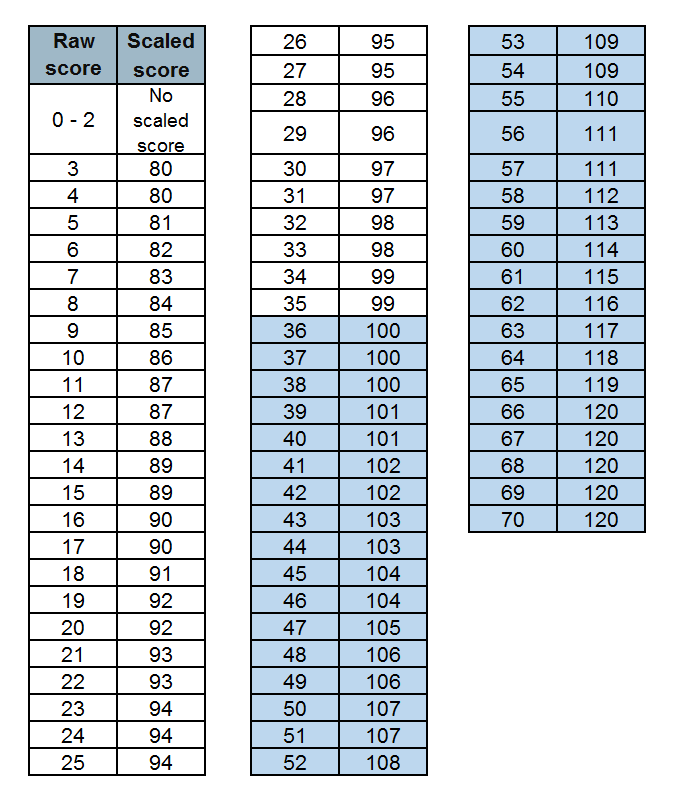
The Department for Education has today released the marks pupils needed for the 2019 key stage 2 tests to achieve the government’s “expected” score.
These scores are for the 2019 academic year. For 2022 scores, click here!
To meet government expectations, pupils must achieve 100 in their scaled scores. But this equates to different marks for each paper (maths; reading; grammar, punctuation and spelling) and can change each year.
Converting a pupil’s raw score to a scaled score simply requires looking up the raw score on the tables below, and reading across to the appropriate scaled score. The tables are also available on the government’s website here.
The marks required for 2018 on each of the key stage 2 SATs tests are:
– Maths: 58 out of 110 (down from 61 in 2018)
– Reading: 28 out of 50 (same as in 2018)
– Grammar, punctuation and spelling: 36 out of 70 (down from 38 in 2018)


children these days are great
In this article you can find a letter written by John Mountford, a former headteacher and OfSTED inspector to his MP (Jacob Rees-Mogg) about the SATs testing regime.
https://rogertitcombelearningmatters.wordpress.com/2018/06/02/it-is-the-attainment-gap-fallacy-that-is-damaging-the-life-chances-of-fsm-children-in-the-north-of-england-and-elsewhere/
This is an extract.
“The KS2 SATs were revised for 2016. In the original version, the raw marks from the exams were used to set National Curriculum Levels, with the raw mark thresholds for each level determined each year by the DfE. The DfE then determined the minimum acceptable proportion of pupils in every primary school that should achieve Level 4. This was the ‘floor target’ with schools failing to meet it being placed in ‘Requires Improvement’ or ‘Special Measures’ categories by OfSTED. SATs have always been ‘attainment tests’ based on specified content set out by DfE.
The post 2016 SATs are different. The concept of National Curriculum levels has been abandoned. The DfE now report SATs results on a ‘scale’ with a mean of 100, a minimum of 80 and a maximum of 120. This is ‘explained’ here (by the conversion charts), except that there is no explanation, just a set of conversion charts, changed each year, to convert raw SATs exam marks to a score on the 80 – 120 scale.
There is no explanation of what ‘attainment descriptors’ apply to the scaled score of 100, nor to any other scaled score including the minimum and maximum of 80 and 120. The only valid statistical alternative to criterion referenced attainment descriptors is norm referenced percentiles. For example the IQ/cognitive ability scale enables percentiles to be obtained for every standard score. It is not clear that the SATs ‘score’ is a standard score at all in the statistical sense. If it was, then the DfE could state the percentile represented by the minimum expected score of 100 for all pupils. In the 2017 SATs, DfE announced that 61% of pupils had met the ‘expected standard’ and attained a scaled score of at least 100. It is therefore clear that the ‘expected minimum scaled score’ of 100 cannot be the 50th percentile if 61 percent attained it last year.
We have asked respected academics of international standing to comment but none have so far made any statistical sense of it. We invite you to take advice from your own contacts in the academic world alongside any response you get from the DfE. It appears that the SATs ‘scale’ of 80 – 120 is not a ‘standard scale’ of any kind. It appears to be an arbitrary creation, along with the conversion tables for converting raw marks into SATs scores.
John and I are not the only educationalists to have challenged the statistical basis of the currents SATs regime, but no mathematically credible explanation has emerged, despite the efforts of Mr Rees-Mogg.
It is depressing to note that nothing appears to have changed.
It’s not a mean. The score is set each year by a panel of teachers assessing whether a child working at the expected standard would be able to answer a given question correctly. Here is some more info: https://www.gov.uk/guidance/key-stage-2-tests-standard-setting
“whether a child working at the expected standard”
Sorry Nicola, but that is meaningless. Children vary. Does it mean ‘any’ child? If so then all children must be equally capable. If not then what child? An ‘average’ child? If so then it must be some kind of average, but if it is then any proportion above 50% cannot not have ‘met the expectation’, whatever ‘expectation ‘ means.
What is the greater depth mark for this year ?
110
We don’t know this yet, it will be published in Sept.
greater depth mark is 110 and over so you need at least 41/50 in Reading ., 55/70 for Grammar,punctuation and spelling. 97/110 for maths . The very top few in the class will get exceeding in all subjects .
Our daughter has achieved over 110 in all tests but the results just say “achieved standard”. Would it say “achieved greater depth” if that was the case? If so, it must be higher than 110. I would be interested to know what it is if anyone knows.
It is statistical nonsense, and appears arbitrary. If I was carrying out cognitive testing then the ‘normal’ range would be 90-110, this is usual in any population statistics, therefore every year the number of pupils ‘passing’ will be a constant percentage. The thing about averages is that you will have 49% of the population above and 49% of the population below the mid point! We clearly need to teach statistics better to the wider poulation ;.)