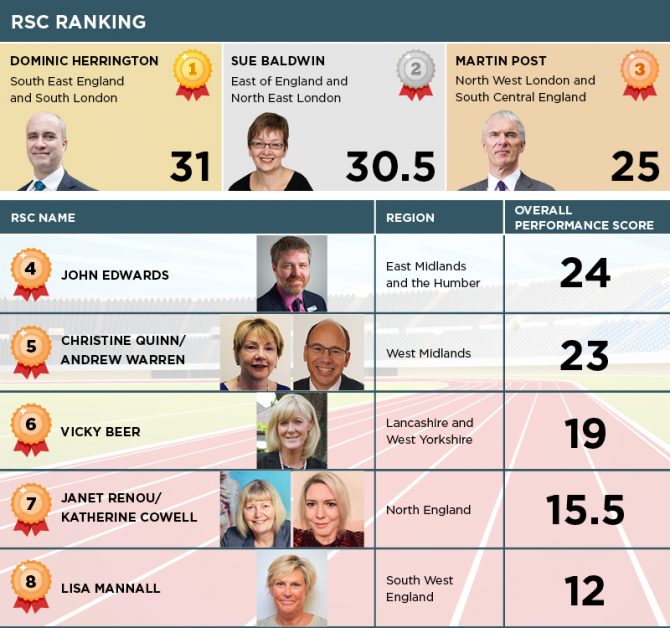
Dominic Herrington has once again been crowned as the best-performing regional schools commissioner, according to Schools Week’s annual league table analysis.
Each year we crunch the numbers to find out how the eight RSCs are faring based on the Department for Education’s key performance indicators for their roles.
The 2018-19 KPIs, published earlier this week, offer a glimpse into the variation between academy performance across different regions last year.
For instance, in the West Midlands, it took nearly a year and half on average to convert inadequate schools to academies – nearly double the length of time taken for schools in the East of England and North East London area.
Our analysis found that Herrington, the former commissioner for the South East of England and South London, came out on top for the fourth year in a row. Herrington has since become national schools commissioner and was replaced by Claire Burton last August.
In a close second place was Sue Baldwin, RSC for the East of England and North East London, with Martin Post, former commissioner for North West London and South Central England, in third.
Post, who was replaced by Dame Kate Dethridge in August last year, climbed two places from 5th place in our analysis last year.

Lisa Mannall, former commissioner for the South West, came bottom. She left the role at the end of the last academic year to become chief executive of the Cornwall Learning Education Trust.
The KPIs have somewhat changed from last year. When asked why this was the case, a DfE spokesperson said the “metrics are used operationally to understand progress over time, in light of regional differences in the school system, and are not intended as measures of individual Regional School Commissioners’ performance”.
How we did it
In our analysis we awarded the commissioners a score out of eight for each of the KPIs.
Top scores in each category got eight points, the second seven, down to the worst performers who got one point.
When there was a draw, then the median point score was awarded. We then added up the scores across the KPIs to determine the final ranking.
Where some regions have seen a change in commissioner during the academic year, we have made that clear below with a / between their names.
The full breakdown
KPI 1a) i) The number and percentage of inadequate inspected academies
Baldwin came out on top here, with just 1.7 per cent of academies rated as inadequate. Herrington was a close second at 1.8 per cent.
However, at the other end, Mannall saw 5.4 per cent of academies in the South West rated as inadequate.
KPI 1a) ii) Number and percentage of inadequate inspected free schools
Edwards and Herrington drew on this, having no inadequate free schools. Mannall has 25 per cent of free schools with the lowest rating, which equates to four schools.
KPI 1a) iii) Number and percentage of inadequate inspected University Technical Colleges
We haven’t included this in our overall analysis because half of the RSCs didn’t have any rated inadequate and, as the sample size is small, we didn’t know whether this was just because they had no UTCs in their region, rather than good performance.
However, Edwards, Herrington, Mannall and Quinn/Warren had one inadequate UTC.
KPI 1b) Number and percentage of previous inadequate local authority maintained schools becoming good or outstanding sponsored academies
Herrington came out on top here, with 82.5 per cent of previously inadequate schools becoming sponsored academies rated good or outstanding. Four percentage points behind were Quinn/Warren at 78.6 per cent.
Renou/Cowell were rated the lowest with 53.8 per cent, followed by Mannall with 59.7 per cent.
KPI 2 a) i) Number of inadequate schools in the process to become an academy under Section 5D of the Academic Act 2010
Again, this has not been included in our overall analysis. In the KPI document, there is no commentary on how the number relates to performance so it is difficult to score who is doing well (we couldn’t work out whether it’s better to have more schools in the process, or fewer). The source of the data is also internal management information, so we couldn’t easily dig deeper.
But the data does show that Quinn/Warren and Beer have the largest number of conversions underway, at 38 and 45 respectively. Baldwin had the fewest at 10.
KPI 2a) iii) Median time taken to convert inadequate schools to academies per region in the last 12 months
Nearly all RSCs saw it take over a year on average, except for Baldwin and Edwards.
Baldwin’s region saw conversions completed within an average of 8.8 months over the last 12 months up to August 2019, while this was 10 months in Edwards’ East Midlands and the Humber region.
However, this increased dramatically for Quinn/Warren in the West Midlands where the average over the last 12 months was nearly a year and a half – 17.3 months.
KPI 2b) Average time taken to deliver academy transfer cases in the last 12 months
Renou/Cowell came top in this one, completing academy rebrokers in just 2.4 months. Quinn/Warren were close behind, taking 3.4 months.
Edwards came last with 6.4 months, on average, in the East Midlands and Humber.
How many academies are RSCs responsible for?
As of August 2019, there were 8,752 academies across England.
Broken down by RSC region, Edwards has the most in the East Midlands and Humber with 1,343.
Mannall had 1,255 while Baldwin had 1,197. Herrington had 1,188, Quinn/Warren had 1,173 and Post had 1,137.
Those with the fewest were Beer with 908 and Renou/Cowell with 551.


Your thoughts