Results in reading, writing, maths and science in key stage 1 assessments have risen this year, while results in the phonics check have stayed largely the same, new Department for Education data has shown.
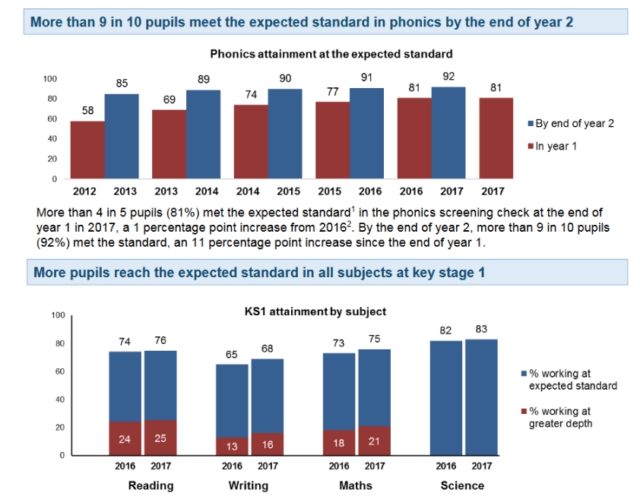
The government’s latest release on the phonics screening check and key stage 1 assessments in England for 2017 shows the proportion of year 1 pupils meeting the ‘expected standard’ in phonics remained static at 81 per cent.
The rate of pupils passing at the end of year 2 has risen by one percentage point from 91 to 92 per cent.
This continues a trend from last year, when the figures for pupils reaching the expected phonics standard by the end of year 2 rose from 90 to 91 per cent.
The percentage of pupils meeting the expected standard, a minimum mark of 32 out of 40 in the phonics screening check, has risen steadily from 58 percent in 2012 to 81 per cent this year for year 1.

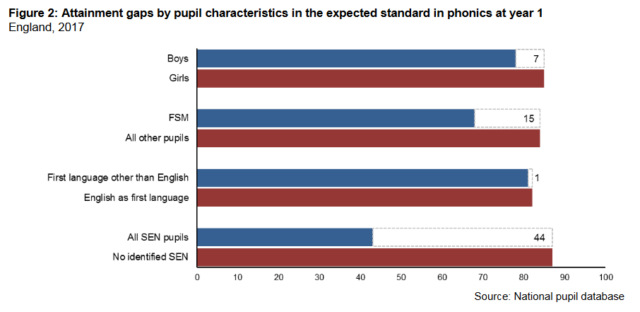
Achievement gaps: gender, FSM, EAL and SEND.

Reading, Writing, Maths: What’s the picture?
Pupil performance rose across reading, writing, maths and science, according to teacher assessments data also included in the DfE release.
There was a bump of two percentage points in both reading and maths.
Reading results rose from 74 per cent last year to 76 this year. Maths rose from 73 per cent last year to 75 per cent this year.
Writing results trailed other subjects, as in previous years. Only 68 per cent met the expected standard – which is still a number of percentage points behind the other subjects, though it is an increase of 3 percentage points on last year.
Girls outperformed boy in all subjects with the biggest gap – 14 percentage points – in writing, where three quarter of girls reached the expected standard compared to 62 per cent of boys.
What is happening in Science?
Science continued to have the strongest results on teacher assessment, rising from 82 per cent last year to 83 per cent this year.
And finally… good news for free schools!
Free schools showed the strongest performance of all types of school again across reading, writing, maths and science. They were followed by converter academies, then local authority maintained schools and sponsored academies.


Be wary of using free school statistics to claim ‘good news’. DfE statisticians warned they were only a tiny group of all maintained schools: 123 primary free schools which took the tests against 12,431 local authority primary schools.
That’s unlikely to stop schools minister and the New Schools Network from thundering that primary free schools achieve better results than all other maintained primary schools.