Something is apparently amiss with maths.
Several school leaders raised concerns in the past 24 hours with Schools Week regarding much lower scores in GCSE maths.
Brian Lightman, general secretary of union ASCL, confirmed this view.
He said: “You have stable national statistics but under that there is a significant number of schools – we are talking double figures, not triple figures – who have results they do not understand. In some cases, and we are talking particularly about the higher level maths Edexcel paper, we have heard from schools that where they are at 70 per cent for English and other subjects, they are at 50 per cent for maths.
“We have to ask the question why, when Ofqual is saying the volatility is low, we are nevertheless getting this.”
And since this morning tweets, messages and news reports have agitated about concerns.
So, is maths problematic this year?
Mr Lightman is right to raise the question. Not least because the stakes are now so important for school leaders, who can lose their job if results are low.
But an important piece of analysis has been released by Ofqual in the past hour. It shows the level of ‘variability‘ in school scores year on year.
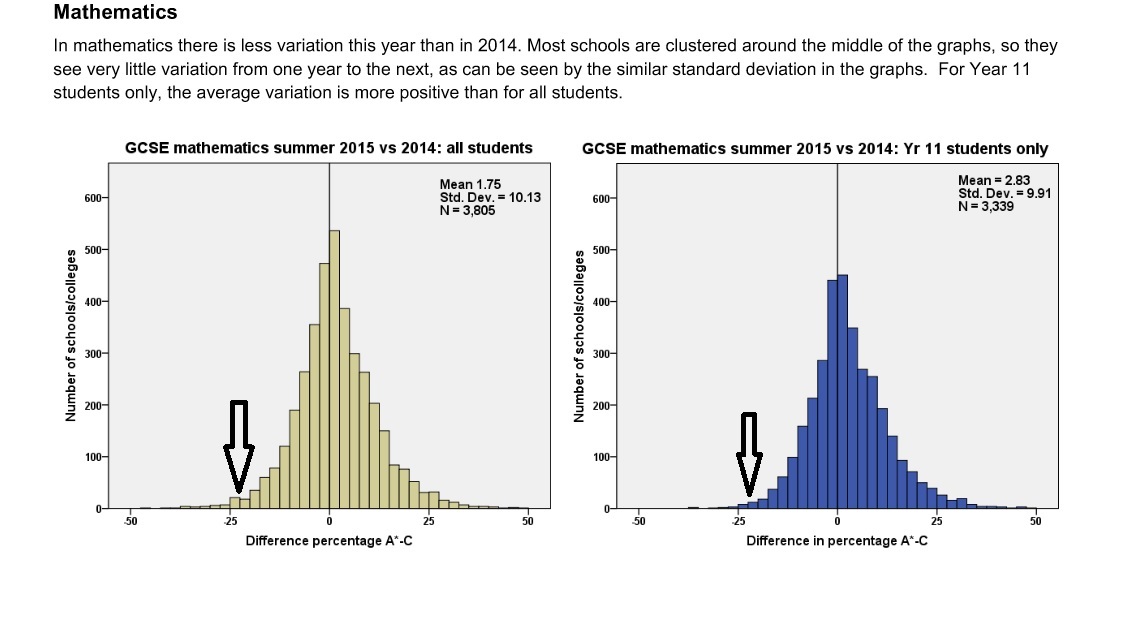
The graph plots the difference between a school’s score, in a particular subject, last year compared to this one. Each bar represents the number of schools who have a particular amount of difference between their 2014 and 2015 annual scores, measured in 2.5 percentage point intervals.
So, for example, the bars either side of zero represent schools that either had a drop of 2.5 percentage points in the their results (left of zero) or an increase by 2.5 percentage points (right of zero).
The graph for maths scores in 2015 is here. The one on the left (yellow) is all students of any age. The one on the right (blue) is year 11 only. For school leaders, blue matters most.

It is tough to see precise numbers under 100 but looking at the all-important blue chart it appears as if approximately 10 schools had a -25% difference in their maths score this year.
Moving to the right about 12 schools dropped 22.5% (this is around where the arrow is pointing). Moving on from that, the bars show that about 15 schools dropped 20%, 30 dropped 17.5%, 55 dropped 15% and 100 dropped 12.5%.
In total, then, about 110-120 schools have dropped more than 15 per cent and around 100 have dropped 12.5 per cent.
This tallies with what Mr Lightman has said – that the numbers are not huge, but there is a chunk of around 110 badly hit schools.
What is worth noticing, though, is that far more schools leapt dramatically in their results. For example, it looks as if approximately 25 schools had a +25% maths score this year.
The numbers of affected schools doesn’t sound very high, but is it many more than last year?
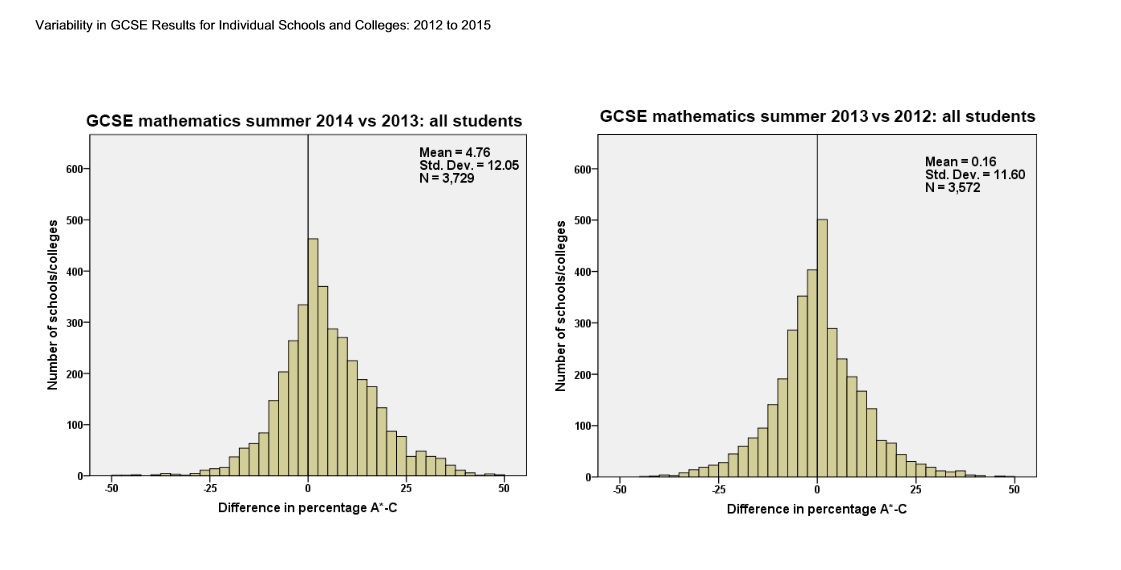
It’s hard to say. Ofqual only has data for all students last year. It doesn’t separate out year 11 only. Comparing the yellow graph below to the one above, you will see there are marginally fewer schools who had a -25% drop in scores but it’s still around 100 schools dropping more than 15% and about 75 dropping 12.5%.

And is maths more volatile than other subjects?
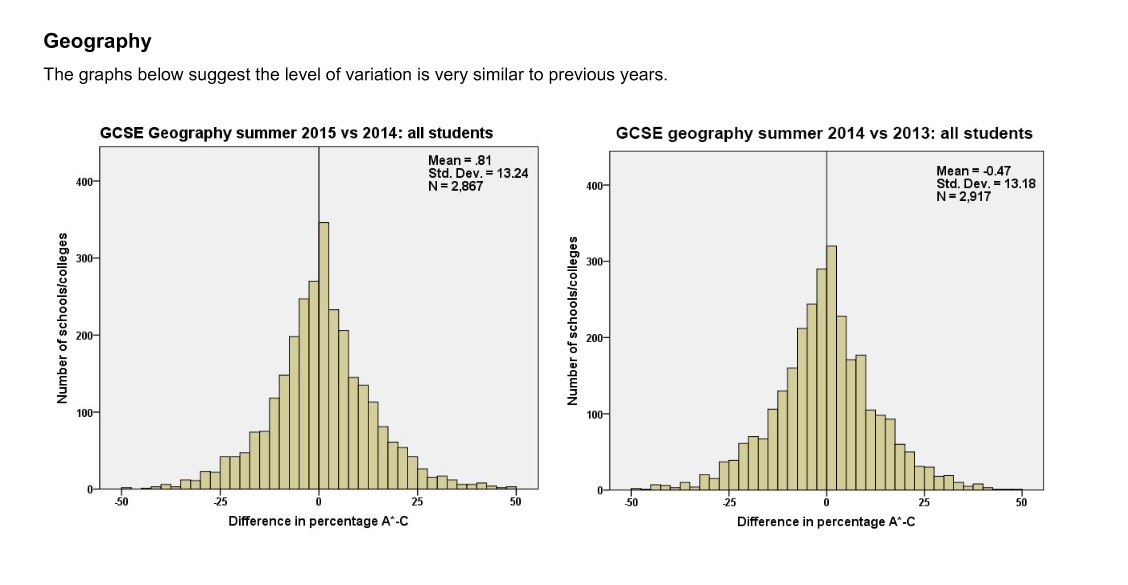
No. The scale is a bit different but this one for geography shows around 50 schools dropping results by 25% this year. That’s much higher than for maths. So this isn’t a Hannah’s sweets conspiracy cooked up to make maths scores look worse than others. It seems to be part of how scores vary across time and across schools.

Does this mean everything is fine with maths then?
Not quite. There’s one more glitch.
It is possible that all the schools who dropped dramatically in maths did so for a particular reason – perhaps an unfair exam paper, or some issue yet to be uncovered.
All the volatility charts tell us is that the number of schools who dropped dramatically is around 100, and that it’s not an unusual number compared to previous years or other subjects.
This does not mean that the drop isn’t baffling or frustrating. But only careful analysis by exam boards and schools will eventually unearth what happened.


Option subjects will always show much greater volatility in schools as, whilst the cohorts of individual schools are often very similar from year to year, the cohorts for students opting for particular subjects can change more significantly AND, in option subjects, if numbers opting for a subject are small then each student can account for a percentage point or two on their own!
Having reviewed the 2015 Edexcel GCSE Higher maths paper and compared it to the equivalent AQA paper, it struck me that the latter appeared easier. Moreover, the 2015 Edexcel higher paper was ostensibly more challenging than in previous years (and definitely less “straight-forward” than in the previous year). This feature in itself does not present an issue as long as the setting of the grade thresholds is consistent with the level of difficulty or otherwise of the respective papers. On the face of it, the AQA thresholds across all grades appeared fair. Where Edexcel were concerned, the A*, A and B thresholds were lowered from the previous year in recognition of the more demanding paper. However, the crucial C and D,E boundaries were raised by some appreciable margin. Taking the average school,it is conceivable that a 2015 high ability cohort and a 2014 cohort with the same ability profile would both have achieved very similar results, say a B+ average. I am not entirely convinced that the same could be said about the respective D/C cohort. I am aware of a signinificant number D/C students who performed much better in mocks based on the 2014 paper but came up short in the Summer 2015 sitting- the variability was lower with B/A/A* candidates, who typically struggle less with the increased emphasis on nuances, problem-solving, language and contextualised questionine.
Of course, cohorts are different year-on-year and the barcontinues to be raised. However, is their an argument for:
1) Giving carers, teachers and school administrators increased confidence that thresholds are applied in a consistent manner across all ability ranges.
2) Boards, Ofqual and any other quality assurers work together to ensure even more rigour and equity in the setting of papers and awarding of grades.
Quite possibly, my comments are off the mark and the grade boundaries by all boards and across all grades are anchored on a very sound and well-reasoned basis. I would be very interested to learn more.
Having reviewed the 2015 Edexcel GCSE higher maths paper and compared it to the equivalent AQA paper, it struck me that the latter appeared easier. Moreover, the 2015 Edexcel Pearson higher paper was ostensibly more challenging than in previous years (and definitely less “straight-forward” than in the previous year). This feature in itself does not present an issue as long as the setting of the grade thresholds is consistent with the level of difficulty or otherwise of the respective papers. On the face of it, the AQA thresholds across all grades appeared fair. Where Edexcel were concerned, the A* and A thresholds were lowered from the previous year in recognition of the more demanding paper. However, the crucial C and D/E boundaries were raised by some appreciable margin. Taking the average school,it is conceivable that a 2015 high ability cohort and a 2014 cohort with the same ability profile would both have achieved very similar results, say a B+ average. I am not entirely convinced that the same could be said of the respective D/C cohort. I am aware of a signinificant number of D/C students who performed much better in mocks based on the 2014 paper but came up short in the Summer 2015 sitting- the variability was lower with B/A/A* candidates, who typically struggle less with the increased emphasis on nuances, problem-solving, language and contextualised questions.
Of course, cohorts are different year-on-year and the bar continues to be raised. However, is their an argument for:
1) Giving carers, teachers and school administrators increased confidence that thresholds are applied in a consistent manner across all ability ranges.
2) Boards, Ofqual and any other quality assurers working together to ensure even more rigour and equity in the setting of papers and awarding of grades.
Quite possibly, my comments are off the mark and the grade boundaries by all boards and across all grades are anchored on a very sound and well-reasoned basis. I would be very interested to learn more.