School census data from January 2016 has been released by the government today. Here are the main points…
1. A smaller proportion of pupils are claiming free school meals

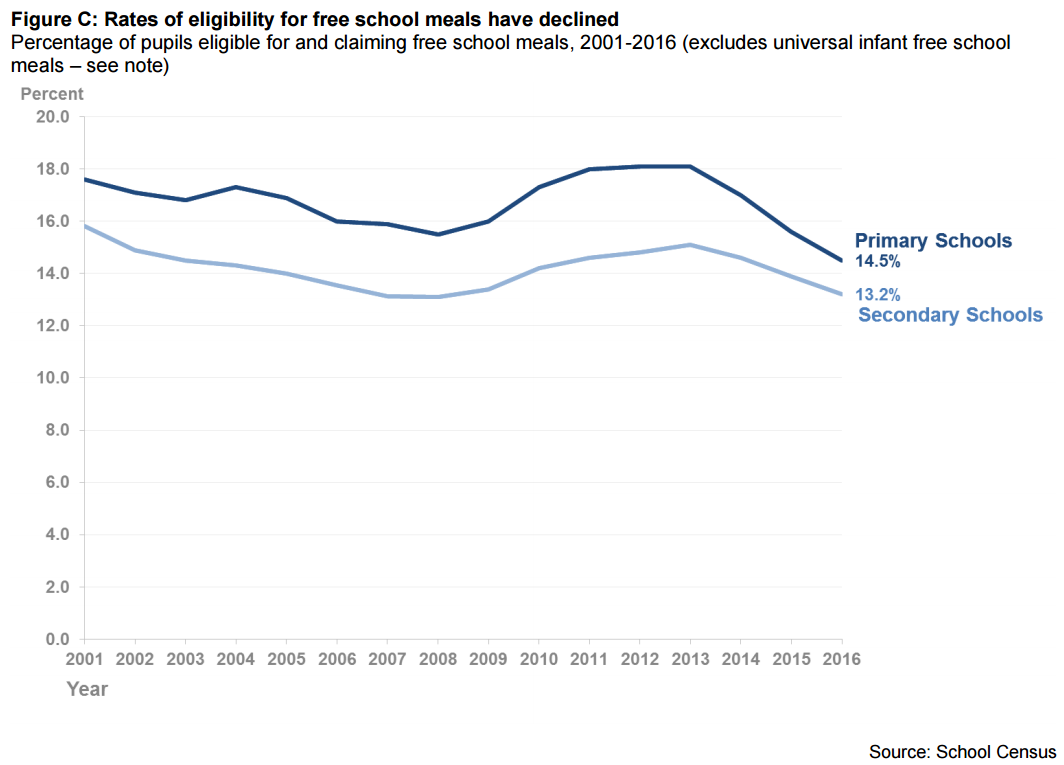
In January 2016, the proportion of pupils claiming free school meals hit 14.3 per cent, the lowest since the collection of pupil level information began.
The government said this is due to a decrease in the number of people claiming benefits.
Department for Work and Pensions early estimate data shows there were 2.475 million people on employment support allowance or incapacity benefit as of April this year, a decrease of 24,000 since November 2015.
But there could be other reasons for the drop in FSM claimants.
A big concern around the introduction of universal infant free school meals has been that parents of those eligible for means-tested meals might not register their eligibility because their children are now automatically receiving free meals.
Parents who don’t register their eligibility also pose a problem for school budgets, as things like pupil premium cash is paid based on the number of FSM-eligible pupils.
2. There are fewer schools overall, and they are bigger
Although there are 32 more state-funded schools open compared to last year, the total number of schools in England has decreased by 29 to 24,288 because of a decline in the number of independent schools and pupil referral units.
In January this year there were 46 fewer independent schools and nine fewer pupil referral units than in January 2015.
This decline, coupled with an increase of 121,000 in pupil numbers, has led to a situation where schools are larger. On average, a state-funded primary school now has 275 pupils, up from 269 in 2015.
3. Fewer infants are being taught in classes larger than 30

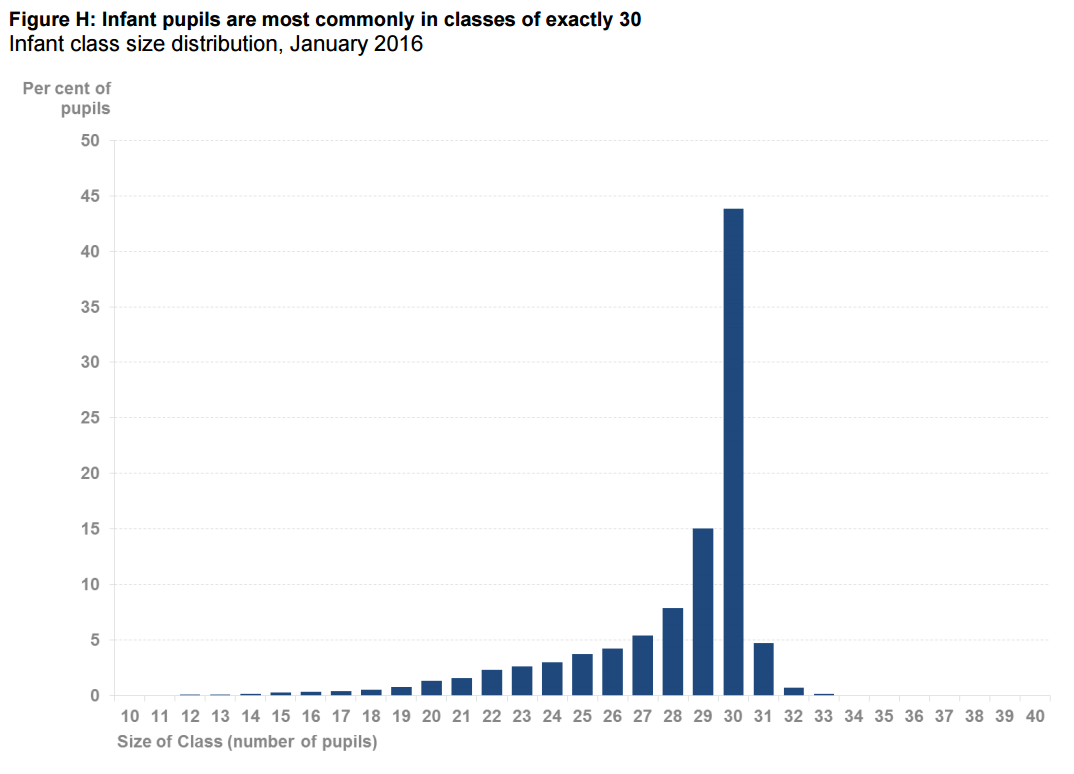
The number of infant pupils in classes of more than the statutory limit of 30 pupils fell from 100,765 (6.2 per cent) in January 2015 to 95,210 (5.8 per cent) in January 2016.
Of those in classes over the limit, roughly 95 per cent of pupils learn in classes of 31 or 32 pupils.
The average infant class size is 27.4, and this has not changed since 2014, but has increased from 25.6 in 2006.
The data shows that more than half of one-teacher key stage 1 classes have 29 or 30 pupils in them. Overall, 43.9 per cent of infant pupils are taught in classes of 30 pupils.
4. The number of EAL pupils is up, but this isn’t necessarily down to new immigration
The proportion of pupils who were exposed to a language “known or believed” to be other than English in their home as of January 2016 was 20.1 per cent, up from 19.4 per cent in January 2015. This follows a steady rise since 2006.
The government says the increase is related to an increase in the number of pupils, which is largely driven by an increase in birth rate, rather than direct current immigration. The number of children of women who weren’t born in the UK has also increased, which is also a factor.
According to Office for National Statistics data, the number of children born to non-UK-born women more than doubled between 1999 and 2010 and the numbers of non-UK born women also increased.
5. The number of pupils with SEN has declined more hastily since the government scrapped statements

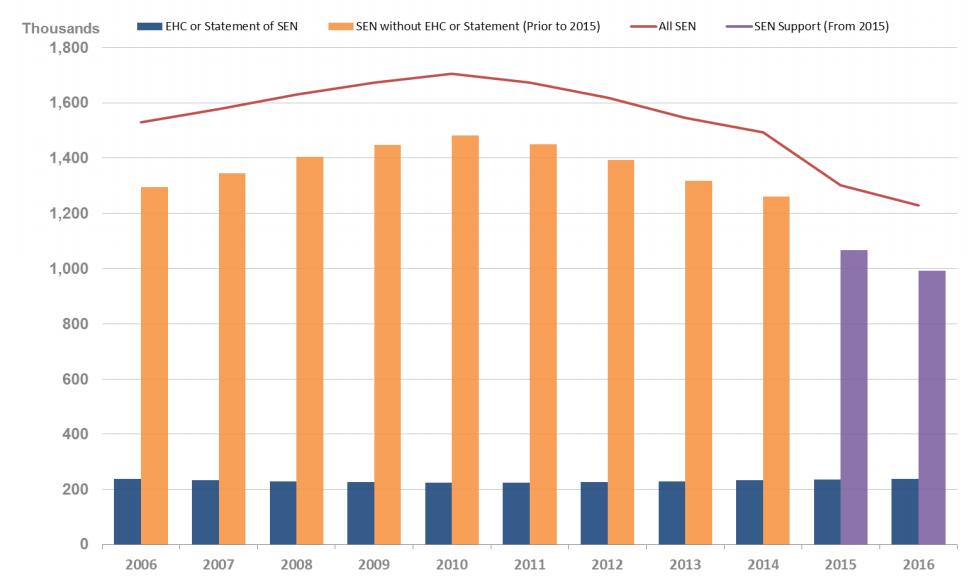
Although the number and proportion of pupils classified as having special educational needs has been in decline since 2010, this has hastened since 2014, when new education and health care plans replaced statements.
According to the latest data, there are now 1.22 million pupils with SEN in state-funded English schools, which represents 14.4 per cent of all pupils. Of this number, 237,000 have a statement or education and health plan and 992,000 have SEN support.
The government says the decline in the number of pupils with SEN has been entirely within the group of pupils who do not have a statement or EHC plan.
Save
Save
Save


Your thoughts