The Department for Education has today released the marks pupils needed for the 2018 key stage 2 tests to achieve the government’s “expected” score.
To meet government expectations, pupils must achieve 100 in their scaled scores. But this equates to different marks for each paper (maths; reading; grammar, punctuation and spelling) and can change each year.
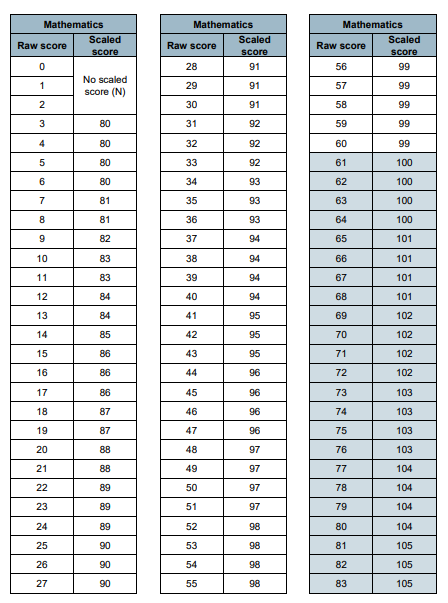
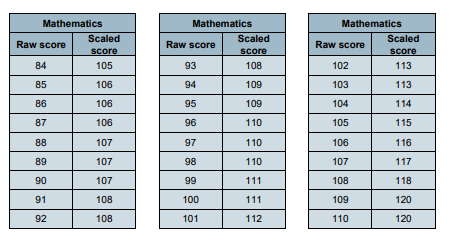
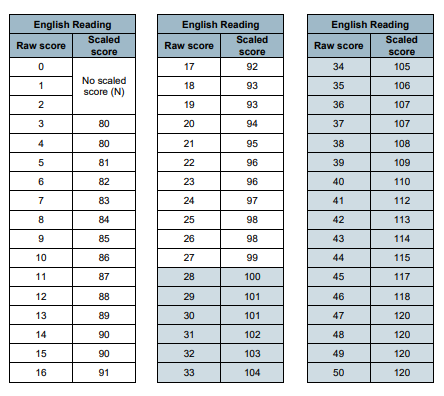
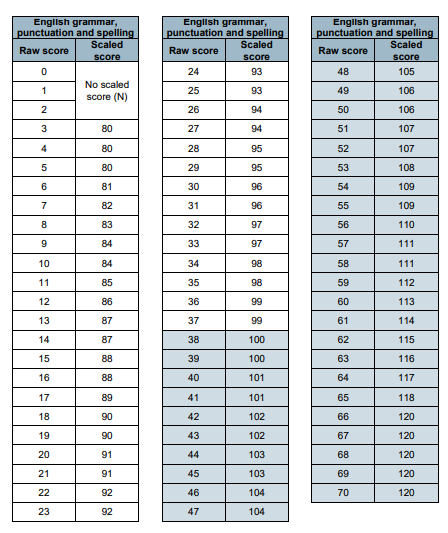
Converting a pupil’s raw score to a scaled score simply requires looking up the raw score on the tables below, and reading across to the appropriate scaled score. The tables are also available on the government’s website here.
The marks required for 2018 on each of the key stage 2 SATs tests are:
– Maths: 61 out of 110 (up from 57 in 2017)
– Reading: 28 out of 50 (up from 26 in 2017)
– Grammar, punctuation and spelling: 38 out of 70 (up from 36 in 2016)
2018 scaled scores for key stage 2 maths SATs
2018 scaled scores for key stage 2 English reading SATs
2018 scaled scores for key stage 2 grammar, punctuation and spelling SATs



These ‘scaled scores’ are entirely arbitrary. My colleague, John Mountford, has been researching patterns between these SATs scores and Cognitive Ability Test (CATs) scores. He has written as follows to his MP, Jacob, Rees-Mogg, as follows.
“There is no explanation of what ‘attainment descriptors’ apply to the scaled score of 100, nor to any other scaled score including the minimum and maximum of 80 and 120. The only valid statistical alternative to criterion referenced attainment descriptors is norm referenced percentiles. For example the IQ/cognitive ability scale enables percentiles to be obtained for every standard score. It is not clear that the SATs ‘score’ is a standard score at all in the statistical sense. If it was, then the DfE could state the percentile represented by the minimum expected score of 100 for all pupils. In the 2017 SATs, DfE announced that 61% of pupils had met the ‘expected standard’ and attained a scaled score of at least 100. It is therefore clear that the ‘expected minimum scaled score’ of 100 cannot be the 50th percentile if 61 percent attained it last year [and 64 percent this year].
We have asked respected academics of international standing to comment but none have so far made any statistical sense of it. We invite you to take advice from your own contacts in the academic world alongside any response you get from the DfE. It appears that the SATs ‘scale’ of 80 – 120 is not a ‘standard scale’ of any kind. It appears to be an arbitrary creation, along with the conversion tables for converting raw marks into SATs scores. In this context, it is important to note that Cognitive Ability Tests, in contrast, are standardised according to established statistical procedures.
John has so far received no reply.
You can read more about this issue here.
https://rogertitcombelearningmatters.wordpress.com/category/blogs/
Sorry, wrong link in my last comment. It should be
https://rogertitcombelearningmatters.wordpress.com/2018/07/10/ofsted-and-outstanding-schools-are-harming-national-educational-attainment/
Though hailed as the most up-to-date and reliable measure of attainment at the end of Key Stage 2, your report is absolutely on the button in declaring that there is no relationship between a raw score and its designated scaled score from one year to the next. So what drives this vital assessment tool that should convince the nation that standards are increasing year on year? In order to substantiate the government’s claims that their reforms are working this manipulation of scores needs to take place. It convinces no one. It is no more than a pipe dream, an expectation and it discredits those who cling on to the vain belief that our children are getting brighter as each cohort outperforms its predecessor.
In relation to the national curriculum test outcomes, NFER (the National Foundation for Education Research) has this to say about scaled scores in its information, “A standardised score of 100 (referring to their own tests) is not the same as, nor equivalent to, the Year 6 scaled score of 100. On NFER tests, a standardised score of 100 represents the average performance of the sample. The scaled score of 100 represents the ‘expected standard’, as defined by the DfE, and is not the same as an average score” The important thing to remember is the ‘expected standard’ is announced by the Secretary of State for Education each year.
In researching the link between SATs and Cognitive Ability tests, it is not my intention to promote the latter, merely to provide definitive evidence that the former are unfit for their intended purpose. From a child’s perspective, however, the use of CATs would offer a benefit over SATs for the ‘summer-born’ as every parent understands .
Very many secondary schools, faced with using the standard scores from KS2 tests for Progress and Attainment 8 targets, are now administering CAT4D tests to their entire cohort at the beginning of Yr7 with the very same children. Not only is this costly in terms of time money and effort, it is deemed necessary because, despite the cost of persisting with SATs, as our research shows, the results are inflated and unreliable, especially for free school meals children.
This is the quote from Nick Gibb to the first part of my enquiry about costs to the exchequer, “The latest data available from the Standards and Testing Agency (STA) regarding the cost to the government of KEY Stage 2 SATs is for the 2016-17 accounting period. The total cost for this period was £42,237,550. Marking, staffing and test development constituted the majority of this figure at £20,455,017, £10,872,424 and £5,473,655 respectively, although in some cases these figures represent the total cost of all primary assessments as the
workload is combined for efficiency.”
Later in the year Roger Titcombe and I will publish our research. In the meantime we are trying to galvanise support in the media to force the government’s hand to come clean over the real story about standards, testing and the damage being done to our young people.