The government published data last week showing how the eight regional schools commissioners are performing, three years after the posts were set up.
Schools Week has crunched the stats to bring you our annual RSC league tables.

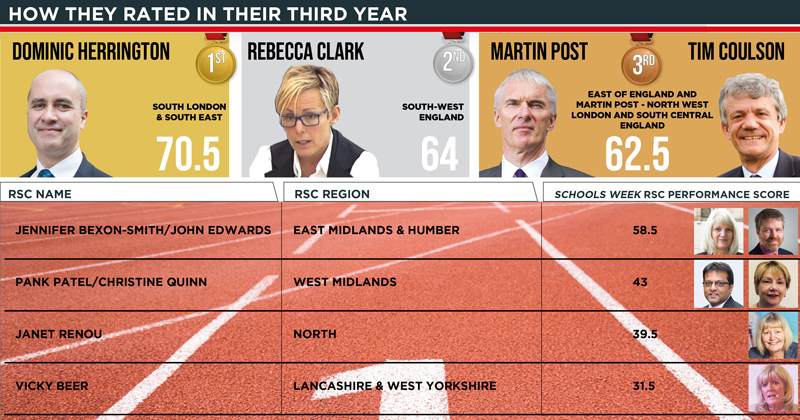
Dominic Herrington has been crowned the top performing RSC for the second year in a row, according to Schools Week’s latest league table analysis.
A new set of performance indicators were used to judge the commissioners’ work in 2016-17, the third year since the posts were established.
Schools Week crunched the data published in the latest academy sector annual report and accounts to show how the RSCs measured up in each category (see below) – and who did best overall.
As in 2015-16, Herrington, the commissioner for south London and the south east of England, came out on top. He has been the RSC for his region since July 2014 and is also the interim national schools commissioner.
Second place went to Rebecca Clark, who was replaced as the RSC for the south west by Lisa Mannall at the end of July last year.

Third place went jointly to Tim Coulson, the former RSC for northeast London and the east of England, and Martin Post, the RSC for northwest London and south-central England.
In our analysis last year Post, who has held his role since August 2014, was third, with Coulson one spot behind him.
Coulson resigned to become the new chief executive of the Samuel Ward Academy Trust in west Suffolk and was replaced by Sue Baldwin in August last year.
The fortunes of Janet Renou in the north of England improved a little in 2016-17, bringing her up one slot from last place.
Vicky Beer, the RSC for Lancashire and west Yorkshire, fell from fifth in 2015-16 to bottom.
Beer, who has been the commissioner in her region since November 2015, scored 31.5 points, eight points fewer than Renou, who became as RSC in September 2014.
Fourth and fifth place went to regions whose commissioners changed mid-year: John Edwards replaced Jennifer Bexon-Smith in East Midlands and the Humber in May last year; Christine Quinn took over from Pank Patel in the West Midlands in October 2016.
In 2015-16 Patel came fifth (after being ranked top in the RSCs’ first year in 2014-15) and Bexon-Smith came sixth.
The eight RSCs have a range of powers devolved from the education secretary, including converting underperforming schools into academies and deciding whether trusts can expand.
Last year was the first time the Department for Education voluntarily published information on their performance, following a successful campaign by Schools Week for more transparency. Before this we created our RSC league tables using data gathered from Freedom of Information requests.
How we did it
We awarded the commissioners a score out of eight for each of the key performance indicators (KPIs). Some indicators were split into sections, meaning RSCs got more than one score for that measure.
The top scorers got eight points, the second seven, down to the worst performers who got one point. In the case of a draw, a median point score was given. We totted up the scores for their final ranking.
It was not possible to compare with the previous year’s performance, as the KPIs have been changed.
The full breakdown
KPI 1i) Time taken for academies, free schools, UTCs and studio schools to move out from below the floor category
Beer and Renou came joint last, both with 1.5 years, while Bexon-Smith/Edwards, Herrington and Clark came joint first with 1.3 years.
KPI 1ii) Number and percentage of academies, free schools, UTCs and studio schools in Ofsted inadequate category for more than 18 months
Beer came last with 20 per cent of her schools (a total of three) rated inadequate for more than 18 months. Coulson, Renou and Herrington came top. No schools in their regions were rated inadequate for more than 18 months.
KPI 1iii) Number and percentage of academies rated Ofsted inadequate within the first three years
Beer came last again, with 5 per cent (31 academies) rated inadequate within first three years of opening.
Post and Herrington did best with only 2 per cent of their academies (19 each) rated inadequate. Renou had the lowest number at 16 (4 per cent).
KPI 1iv) Number and percentage of academies at key stage 2 and 4 below the floor standard within the first three years
Another bad outcome for Beer with 20 per cent (94 academies) at KS2 and 4 below the floor standard within the first three years.
Bexon-Smith/Edwards had the greatest raw number of academies in this category at 117.
Post had the lowest percentage at 12 per cent (88 academies), but Coulson had the lowest number (47).
KPI 1v) Number and percentage of free schools, academies and sponsored academies that are good or outstanding
This is split into three separate tables – one based solely on free schools, one sponsored academies, and one for all academies.
Herrington had the highest percentage in each group – 95 per cent for free schools (36 schools), 93 per cent for sponsored academies (591), and 88 per cent for all academies (780).
Renou had the lowest percentage of free schools and sponsored academies rated good or outstanding, at 57 per cent (four schools) and 84 per cent (248 schools) respectively.
Renou and Beer had the joint lowest percentage of all academies with the two top grades, at 80 per cent each (282 and 477 academies respectively).
KPI 2) Number and percentage of local authority (LA)-maintained schools opened as converter academies within 12 months of receiving an academy order
Patel/Quinn scored lowest here, with 84 per cent of council schools opened as converter academies within 12 months of receiving an academy order (112 schools).
Renou came top with 100 per cent of her LA schools (54) hitting the target.
KPI 3) Number and percentage of LA-maintained schools opened as new sponsored academies within nine months of an inadequate rating, broken down by:
1: Inadequate schools that opened as sponsored academies between August 1, 2016, and July 31, 2017
Patel/Quinn came last with only 21 per cent of their inadequate LA-maintained schools opening as sponsored academies within nine months (four of 19). Clark came top with 63 per cent (five schools out of eight).
2: Schools rated inadequate after April 18, 2016 that opened as a sponsored academy between August 1, 2016, to July 31, 2017
Renou came last in this section with zero and Herrington came top with 100 per cent (four out of four).
Bexon-Smith/Edwards had the highest number of schools (12).
KPI 4i) Number and percentage of schools in a multi-academy trust, as at September 21, 2017
Post did worst here, with 68 per cent of his schools in a MAT (667 schools). However, Renou had the fewest schools in trusts at 321.
Coulson did best with 84 per cent of his schools in a MAT (796 schools), while Bexon-Smith/Edwards had the greatest number of schools at 835.
KPI 4ii) Number and percentage of MATs open for three years and over, that have three or fewer schools, as at September 21, 2017
Renou did worst with 66 per cent of her MATs (53) open for three years or more having only three schools or fewer. Bexon-Smith/Edwards did best with 40 per cent.
But Post had the highest number of MATs falling into this category, at 93 (60 per cent), while Renou and Cark had the lowest at 53 (66 per cent) and 53 (43 per cent) respectively.
More schools does not mean more money
The budgets received by each of the eight regional schools commissioners (RSCs) this year varied by almost £600,000, new figures have revealed.
Workforce budgets ranged from £1.52 million in the southwest of England, overseen by Lisa Mannall, down to £950,000 in northeast London and the east of England, headed by Sue Baldwin.
The figures also show that more schools does not mean more money. John Edwards, the RSC for East Midlands and the Humber, has 1,239 (the most of any RSC), but received £1.25 million this year – £270,000 less that Mannall, who manages 55 fewer schools.
In the north Janet Renou had a budget of £990,000 this year for working with 507 schools, while Baldwin had £40,000 less for working with 1,137 schools.

When the budgets are divided by their number of schools, Renou comes out on top, with nearly £2,000 for each of her schools. Baldwin is at the bottom with only £835.53 for each school.
The data also revealed varying numbers of staff in each RSC’s department. In September, Vicky Beer in Lancashire and West Yorkshire had the most full-time equivalent staff members at 65. She also had the second highest workforce budget at £1.40 million.
Renou had the fewest full-time equivalent staff members at 40.3. She also had the fewest schools for each staff member at 12.6, while Martin Post, who oversees northwest London and south-central England, had the most (23.6).
When each RSC’s workforce budget is divided by employees, Mannall has the most at nearly £27,500 for each staff member, while Baldwin has the least, at just over £18,000.
The information was released in an answer to a parliamentary written question from Stephanie Peacock, a former teacher and MP for Barnsley East, who said the “soaring costs” of the RSCs were another consequence of the “inefficient and fragmented schools system”.
According to Lord Nash, the former academies minister, the commissioners’ budgets are made up of a “programme budget” to cover “events and other communications activities”, and an “administration budget” for staff costs, such as salary and travel. On top of this each RSC has a headteacher board budget, which is used to recompense board members for their time.
The cost of the RSCs has been an ongoing source of concern, ballooning from £4 million in 2014-15, to about £30 million. Last year Mary Bousted, the joint general secretary of the National Education Union, said the climbing costs called into question whether the RSC network was “fit for purpose”.
A Department for Education spokesperson said: “Workforce budgets are set relative to our assessment of the needs of each region. They are monitored and reviewed and can change in-year.”


Your thoughts