Progress 8 is only “slightly” better at assessing the performance of schools fairly, and still has flaws that need ironing out, a new report has claimed.
The Education Policy Institute (EPI), which has looked at government data on the accountability measure, found schools with lots of disadvantaged pupils do not fare much better than they did under the old five A* to C GCSE measure.
This is despite Progress 8 being introduced to avoid the accountability system giving a disadvantage to schools with relatively low-ability intakes.
At the same time, a pupil who performs especially badly in their Ebacc subjects can have a “disproportionate impact” on a school’s overall score, the report found.

It can also punish special needs schools, because pupils are being compared to other pupils of similar prior attainment who do not have learning disabilities.
The findings call into question whether the new Progress 8 measure is managing to show anything “significantly new”, said Jon Andrews, the author of the report and deputy head of research at the EPI.
He urged the government to do more to consider the context of schools in Progress 8.
Here are the key findings:
1. Nearly the same schools do badly in Progress 8 as in GCSE attainment
Progress 8 has “only slightly” changed how schools are ranked, the report says.
Schools with lots of disadvantaged pupils are still generally those which fall below the floor standard on progress (below -0.5).
It follows Schools Week previously reporting that more than a third of schools below Progress 8 floor standards were sponsored academies, which generally have more pupils on free school meals.
2. London and the east outperform the north
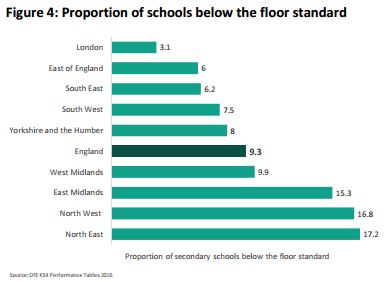
In London, just three per cent of schools were below the floor for progress. The city was followed by the east of England (six per cent) and other southern areas.
This contrasted strongly with the east Midlands, north-west and north-east. In the north-east, nearly a fifth of schools (17.2 per cent) were below the floor.

3. Pupils at non-selective schools in selective areas are a tenth of a grade behind
Pupils at grammar schools achieve a third of a grade higher than their peers with similar prior attainment. See point 5 in our previous explainer on Progress 8 here.
But pupils in highly selective areas and not in a grammar school see “a penalty of a tenth of a grade” as a result.
4. Disadvantaged pupils do better than peers in just 6% of schools
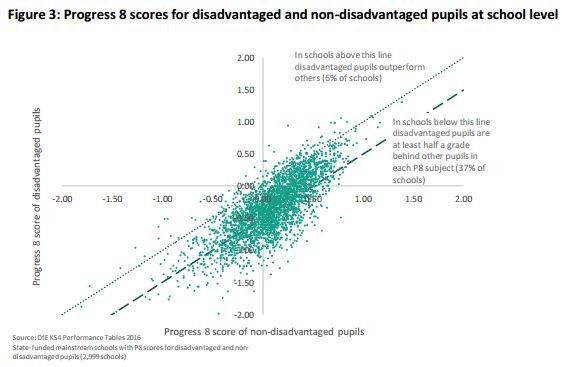
Only six per cent of schools help their disadvantaged pupils achieve better grades than their more affluent peers.
In more than a third of schools, disadvantaged pupils are “over half a grade” behind their peers.

5. Chinese pupils are the highest performing ethnic group
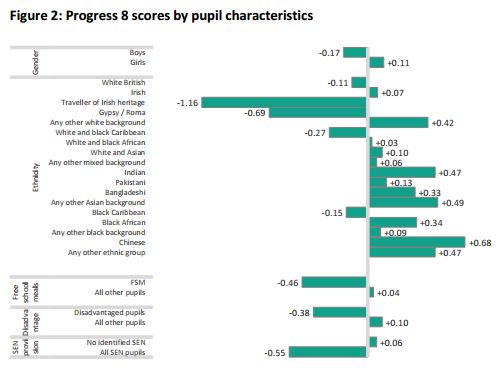
Chinese pupils achieve two-thirds of a grade higher in each subject than pupils with similar grades beforehand, the report found.
White British and Black Caribbean pupils have some of the lowest progress scores, with the small proportion of traveller and Roma pupils faring worst.
Girls outperform boys by just over a quarter of a grade.


Interesting article