The government has published analysis of provisional GCSE results data which shows for the first time national analysis of Progress 8 scores and other measures in its new accountability system for schools.
From this year, schools are judged based on their attainment 8 and progress 8 scores, attainment in English and maths and the number of pupils entering and achieving passes in the EBacc subjects (English, maths, history or geography, the sciences and a language). (Our EBacc analysis is here)
Progress 8 measures pupils’ progress across eight subjects from age 11 to 16, while attainment 8 measures average attainment across those subjects, here are the key findings:
1. First up, we have Progress 8 scores!
So, the data shows Progress 8 scores for mainstream schools ranged from -2.5 to 1.5. But nearly all schools (97 per cent) fell somewhere between -1 and +0.7.

2. Attainment 8 scores are up, but it’s because more pupils are taking EBacc subjects
The average attainment 8 score per pupil has increased by 1.2 points to 48.2 per cent in all schools, and 1.6 points to 49.8 per cent in state-funded schools.
But the biggest increase is in the EBacc element – suggesting this increase is driven largely by the behaviour change in schools with pupils filling more EBacc slots.
Attainment for English and maths increased by just 0.1 percentage points for each subject (below).

3. English and maths A* to C is also up (although just how much depends on which methodology you use)
The attainment in English and maths (A* to C) in all state-funded schools has risen from 58.3 per cent in 2015, to 58.7 per cent this year.
However there is also another figure listed for 2016 – 62.6 per cent – which shows a much larger rise.
But this figure (warning: this gets abit technical) is based on a new methodology that requires pupils on the English language pathway and English literature pathway to achieve an A* to C in either, with no requirement to take both. (Previously pupils had to take exams in both, and achieve A* to C in English language)
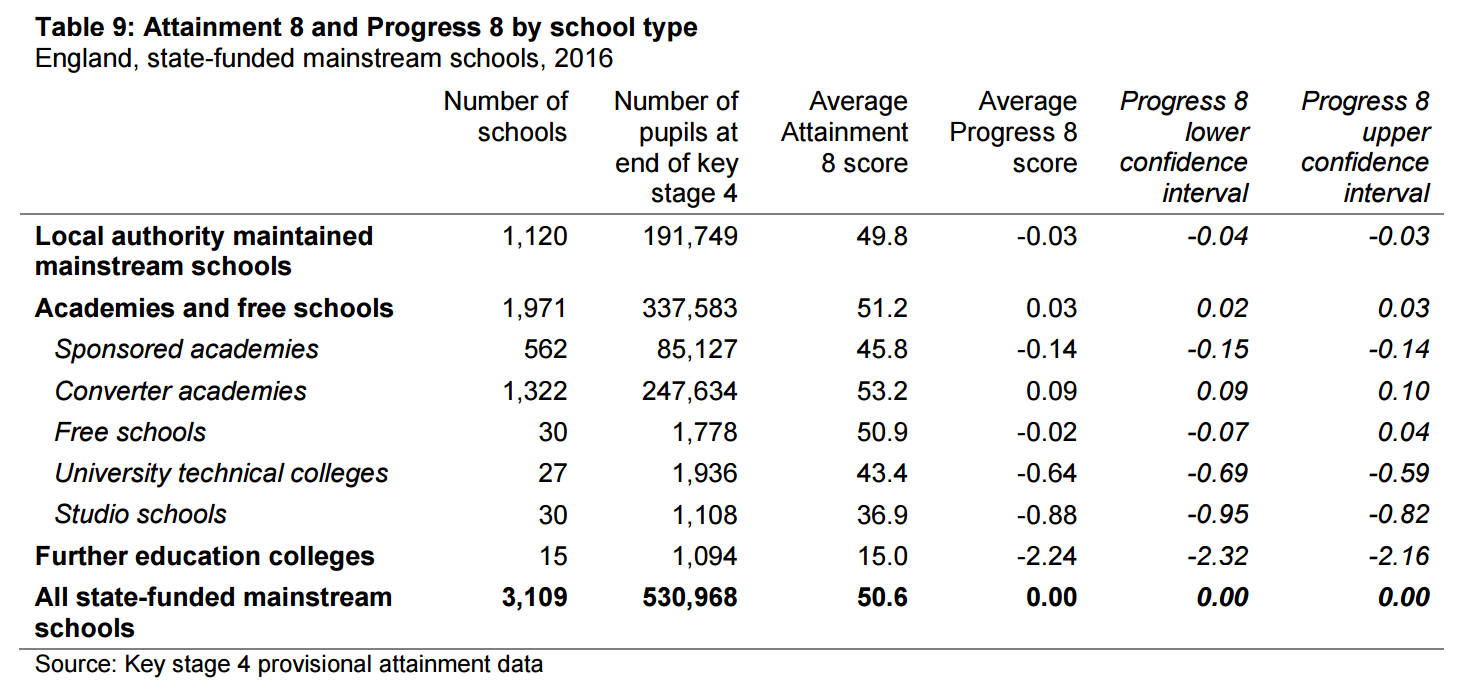
4. A deeper dive of the data shows that sponsored academies, UTCs and studio schools are lowest performers at Progress 8
The first ever release of progress 8 figures shows a worrying, but not unexpected trend in scores based on types of school.
Progress 8 scores are based around an average point of 0, meaning those with positive scores are above-average and those with negative scores are below-average.
Although academies overall have an average score of 0.03, compared to an average among all local authority-maintained mainstream schools of -0.03, there is a big variation in score between different types of academies, with sponsored academies, UTCs and studio schools all doing comparatively badly.
Similar trends are seen in attainment 8 scores.
We know what you’re thinking. The progress 8 score for FE colleges is very low, but the government has an explanation for that…
“The number of FE colleges offering 14-16 provision with year 11 pupils is too small to allow robust conclusions to be drawn about their performance. Interpretation of the figures is also limited by the fact that FE colleges do not complete the pupil level school census, meaning the department does not have as accurate a record of pupils at the end of key stage 4, as it does for other state-funded schools.”
5. The data confirms selective schools do much better than their mainstream counterparts in Progress 8
Today’s statistics show that selective schools had an average progress 8 score of 0.33, while comprehensives had an average score of -0.01 and secondary moderns -0.05.
But Schools Week readers will already know that. We covered recent research by Education DataLab which first revealed selective schools do much better in progress 8 than comprehensive schools or secondary moderns, and explains why.
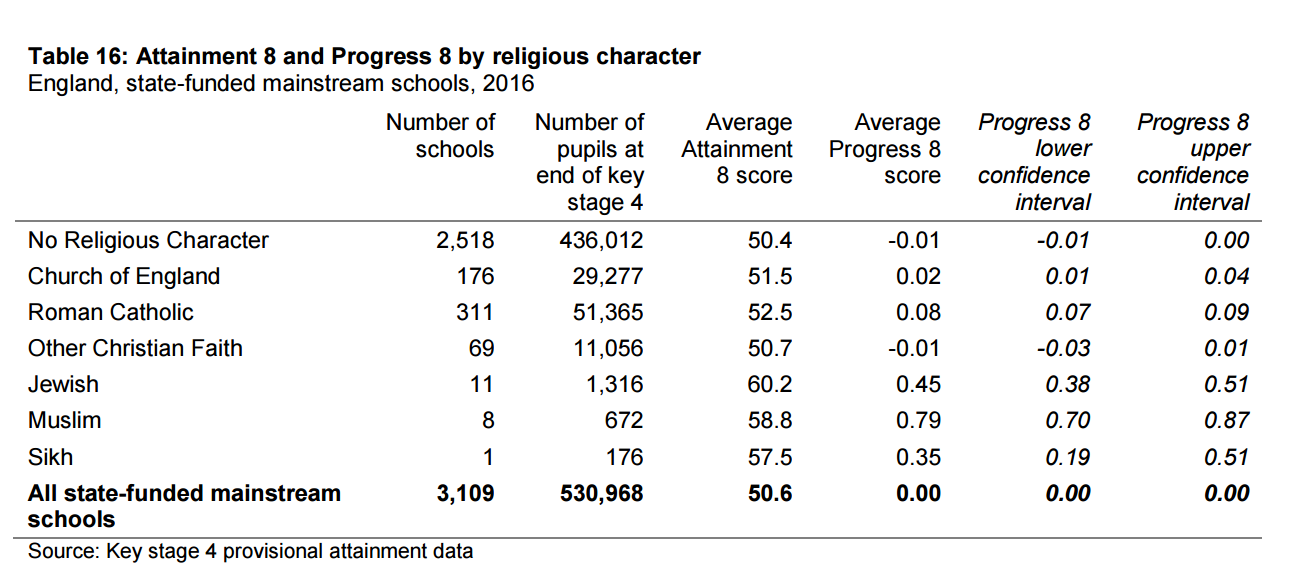
6. Religious schools mostly outperform those without a religious character – with Jewish, Sikh and Muslim schools way ahead
The statistics also show that Jewish, Sikh and Muslim schools are doing much better against progress 8 compared to those of Christian faiths or no religious character.
Muslim schools this year had an average progress 8 score of 0.79, while Jewish schools scored 0.45 on average. The average score among Sikh schools was 0.35.
This is compared to average scores of 0.08 for Roman Catholic schools, 0.02 for Church of England schools and -0.01 across schools with no religious character.
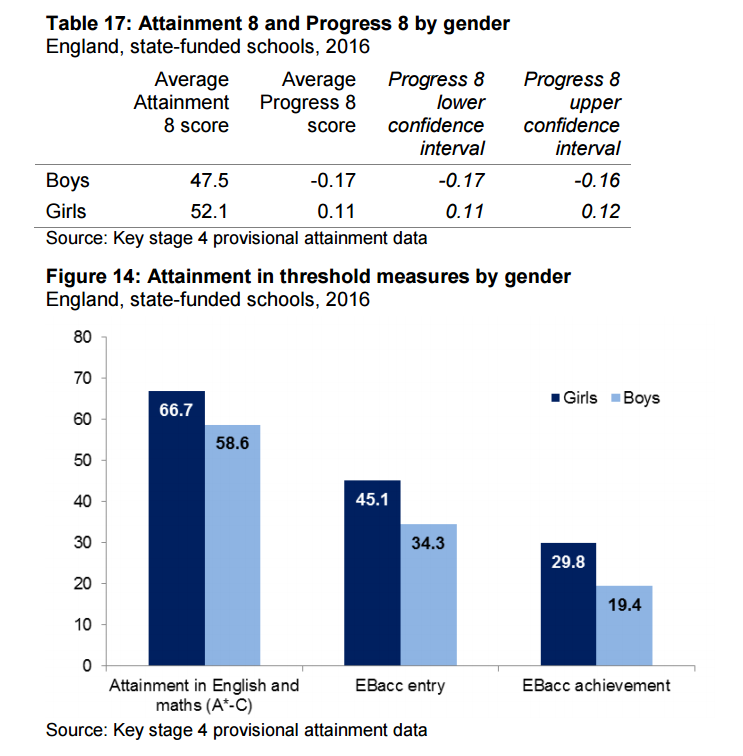
7. Girls are doing better than boys across the board
It is already well-established that girls to better than boys at key stage 4 in terms of average attainment, but the new data shows that trend is similar in progress 8.
The average progress 8 score among boys is -0.17, compared to an average score for girls of 0.11.
Girls are also ahead of boys in terms of entry to the EBacc and subsequent achievement of the headline measure.
8. Attainment 8 scores vary considerably based on geography
The data shows that the highest-performing local authority areas for attainment 8 are concentrated in London and the south, while the majority of the lowest-performing areas are in the north and midlands.
In its release, the government has highlighted a similarity in the pattern to that of 2015 attainment 8 data and provisional scores for the proportion of pupils getting five GCSE A* to Cs including English and maths.


With 163 grammar schools there must be more than 117 secondary modern schools. This means there are the equivalent of about 370 secondary modern schools hiding in the comprehensive data. Should this not be taken into account.
Not all non-selective schools in selective counties are labelled ‘modern’. They are labelled ‘comprehensive’. But their intake might not be a fully comprehensive intake.
I’m not sure it’s safe to draw much of a conclusion from the data about religious schools when some of the numbers are so small in absolute and in percentage terms: there are only 20 Jewish, Muslim or Sikh schools listed which equates to well under 1% for all 3 combined.
The article even refers to the “average score among Sikh schools” when it is in fact an average across a sample size of 1.
Do you have a progress 8 score for pupil premium students at a national level? Additionally are there p8 scores for pupil premium girls and pupil premium boys?
Thanks
Martin
So basically a lot of data with the results subject to interpretation, as always. It cannot be ascertained if the school’s teaching was the reason for the improvement or the overall intelligence of the pupils of that year group was the reason. It offers very little guidance to parents.