Pupils in primary schools across the country vary in their progress – under the government’s new value-added measure – in some kinds of schools than others, government data released today shows.
Those in faith schools perform marginally better, with Jewish schools leading the way, than pupils in non-religious schools on average.
Pupils in sponsored and converter academies see a dip in progress scores somewhere around three years after first opening – with converter academies then pulling back.
And maths is the subject that varies most widely across different local authorities.
The government’s data came from the 14,930 state-funded mainstream primary schools with key stage 2 results in 2016. Some 82 per cent were local authority maintained, 12 per cent were converter academies, 6 per cent were sponsored academies and just 28 were free schools.
1. More pupils had progress just above the national average, than those who did not
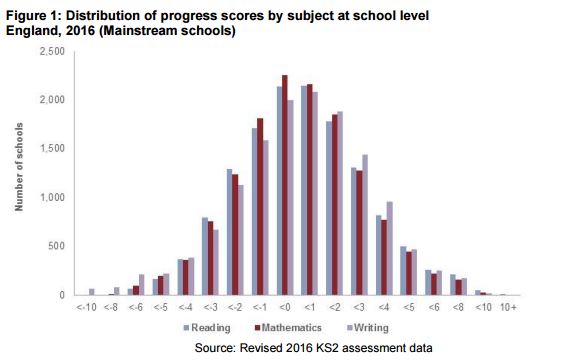
From 2016, the new “value-added” progress measures aim to capture the progress that pupils make from the end of key stage 1 to the end of primary school.
They are represented as positive or negative numbers. A score of zero means that pupils in a school made the same progress as other pupils nationally with similar prior attainment.
A positive score means they made more progress than pupils with similar starting points to them nationally, and a negative score means they made less progress than pupils with the same starting points.
A negative score does not mean they made no, or negative, progress – just less than other pupils who started off in the same place as them test-wise.
We can see there were more pupils who made slightly more progress (+1) than the national average than there were pupils who fell below that average.
2. Free school pupils made the least progress – even less than in sponsored academies
The report notes that “pupils in free schools made less progress in all subjects relative to all pupils with similar prior attainment in other types of schools.”
But there were only 28 free schools with 11-year-old pupils so “robust conclusions” could not be drawn, it added.
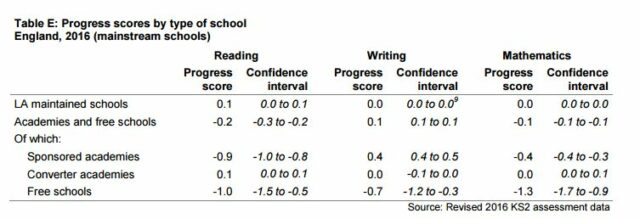
Sponsored academies saw a progress score of -0.9 in reading, 0.4 in writing and -0.4 in maths on average.
The free school progress in the data cohort was considerably less, at -1.0 in reading, -0.7 in writing and -1.3 in maths.
3. Local authority school pupils made as much progress as those in converter academies
The vast majority of primary schools in the data set (82 per cent) were local authority maintained, with just 12 per cent being academies.
Their performance in progress was exactly equal on average. Both types of school saw a 0.1 value-added score for reading, a 0.0 score (the same as the national average for progress) for writing, and the same again for maths.
4. Sponsored academies don’t improve their progress scores over time
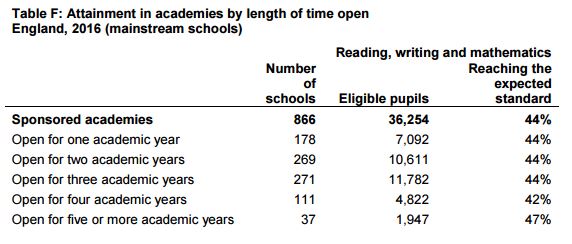
Just 6 per cent of the primary schools in the data were sponsored academies.
“Pupils in sponsored academies made less progress than pupils with similar prior attainment in other types of schools, in both reading and mathematics,” the report noted. Sponsored academies did make more progress than the national average in writing.
But over time that progress stagnated. Small improvements in progress around about the three-year mark then fell back to similar progress results (in writing and maths) or worse results (in reading) by about five or more years after opening.
5. Converter academies see some improvement, with a slight dip somewhere around the three-year mark

On average across all converter primary academies, progress scores for reading moved to 0.4 above other pupils’ with similar prior attainment after five or more years, up from 0.1 on opening.
But there was a -0.3 dip at about the three-year mark.
Writing progress scores stayed the same as the national average over the five years, with a dip to -0.1 again after three years.
And maths saw progress rise above the national average after five years, with another slight dip after three years, up to 0.2.
6. Medium-sized schools do better overall than large or small primary schools

There is more difference by school size in terms of progress scores, than by attainment scores, the data showed.
Larger schools make less progress with pupils in reading.
And both pupils in small (1 to 15 pupils) and large schools (91 or more pupils) made less overall progress in writing and mathematics than those in medium-sized schools (between 16 and 60 pupils).
Primary schools with more than 91 pupils achieved a -0.8 progress score on average in reading and maths, and -0.7 in writing – compared to a progress score of 0.2 in maths and writing for schools with 31 to 60 pupils.
7. Maths progress varies the most out of all subjects between local authority areas
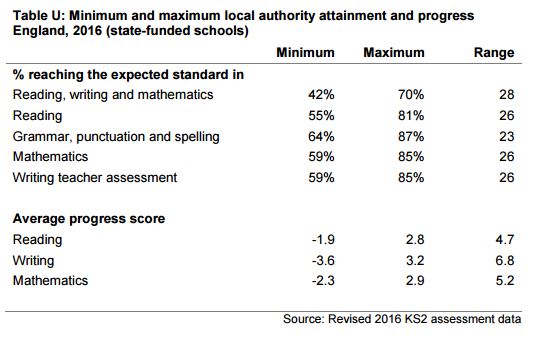
As in previous years, there is “considerable” variation between local authorities in attainment and progress, said the report.
The biggest difference in average progress scores is in mathematics.
8. Jewish schools saw the best progress scores out of all faith schools
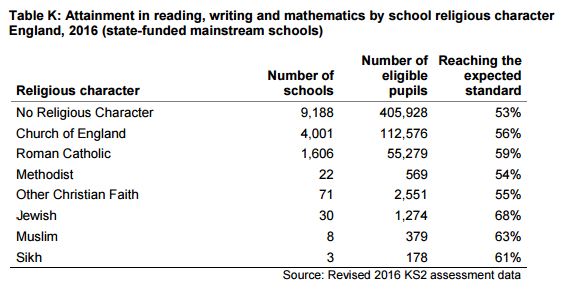
Jewish primary schools saw on average a progress score of 1.3 in reading, 0.2 in writing, and 1.3 in maths.
These were closely followed by Roman Catholic schools, whose pupils saw the best progress in reading and similarly somewhat less in writing.
Muslim schools saw by far the highest progress in writing scores among pupils, at a 2.1 value-added score on average.
All faith schools except Sikh schools, Methodist schools and those of other Christian faith outperformed schools of no religious character overall.


Your thoughts