GCSE results out. Ofqual have released numbers showing the dips and rises in school numbers. It shows a quirk with science.
Each year on results day Ofqual produce boring-sounding ‘variability charts’. Dull name, but important data.
These charts show how many ‘centres’ (schools or colleges) dropped or increased their results compared to the previous year.
What this year’s charts show is a very calm picture for maths and English – but a real issue for science.
GCSE English: A picture of stability
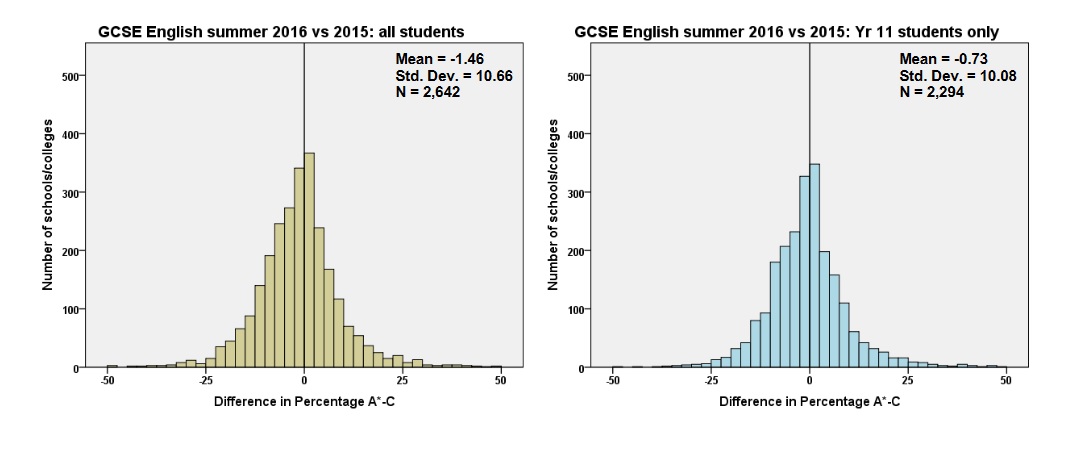
DO NOT PANIC. These look complicated, but they’re not.
The line through the middle (0 on the bottom axis) represents no change for schools. The bar on the right of the central line is at around 370. What this means is that 370 schools had their year 11 A*-C pass rate increase by between 0 and 2.5 percentage points. The bar on the left of the central line shows that around 350 schools decreased their pass rate by between 0 and 0.25 percentage points.
Each bar represents a change in pass rate of 2.5 percentage points. The further you go away from the centre, the more schools have decreased or increased their pass rate.
On the left hand side, where the bottom axis shows -25 percentage points, you can see that only a few schools are in this situation. (Around 5 by my estimate). Likewise, only a very small number of schools have increased their results by 25 percentage points or more.

The nice thing about these tables is that we can see how similar things are this year to last year. If the two graphs look roughly similar, then not much has changed. Here we can see there is a bit more movement to the left, but not much.
For English, this year, we can see that things are reasonably stable and that school’s results have changed slightly less than in previous years.
There is a slight bump around the 30 percentage point decrease rate, which suggests a few more schools have been hit with a decrease – but it’s a very small number.
Basically: there should not be more school leaders facing dramatic changes in their English results compared to last year.
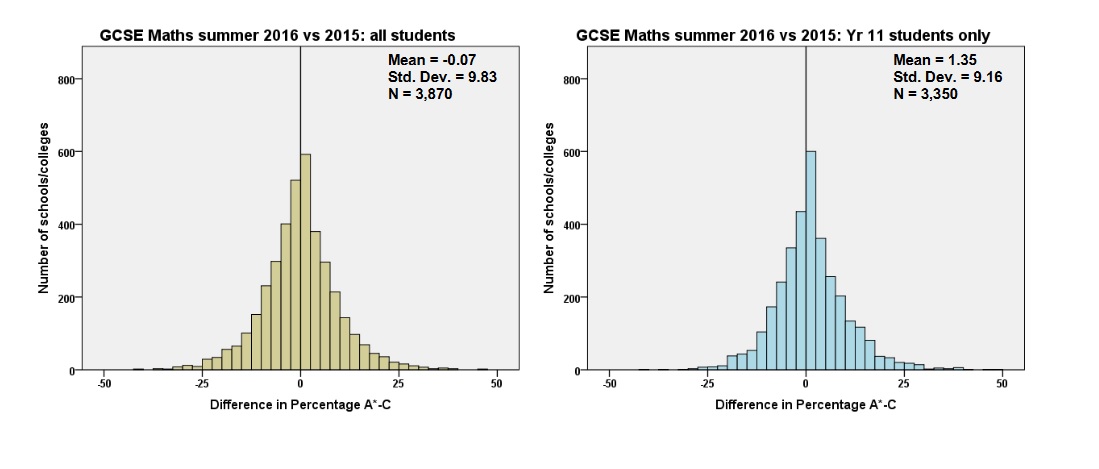
GCSE Maths: No surprises
Maths also has less variation this year – and for any year since these graphs started in 2013.
One reason is likely to be that there were no big changes in cohorts, or fiddles with modules, or performance measures.
Unfortunately, this is likely to change next year with the newly reformed maths GCSEs. Sigh.

GCSE Science: Uh-oh. What is going on?
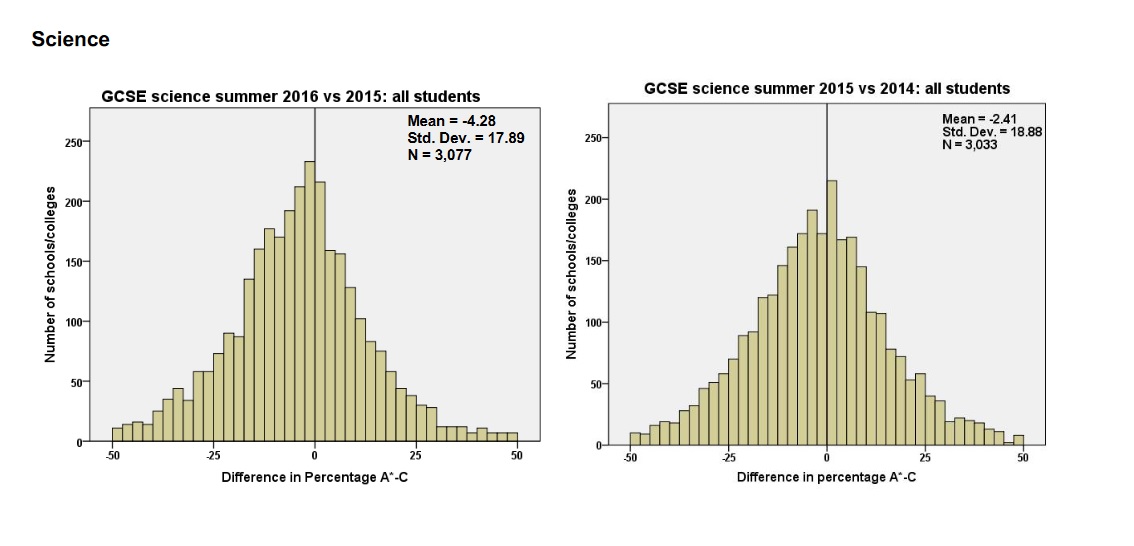
Ofqual haven’t written any commentary about science, but the graph suggests there are many more centres likely to see their results decrease in science than increase.
The left-side of the graph (the decrease side) is much fuller than the right side, and the graph shows that around 250 centres have seen their science scores decrease by more than 25 percentage points. That’s a lot more centres than in English and Maths (where the numbers look to be around 40).
Unlike in previous years, this isn’t balanced by equally high numbers of schools getting large increases in results, which suggests a genuine imbalance this year. Something is pulling scores down.
At a briefing this morning by the exam boards, a spokesperson said that entry patterns had changed. Pupils who previously didn’t do science, or did other science qualifications – for example BTECs – are now doing GCSEs. This change has likely happened because schools can no longer count BTECs in performance tables as they did before.

This has important implications if you lead or line manage a science department.
First, if you are seeing a drop in results, it’s worth knowing that this is not uncommon. It could be that there is a problem with your science teaching, OR it could be a function of who is taking the exams. It is vitally important to look at the demographics of the pupils and see if there was a cohort change before implementing big changes.
It’s also worth remembering that schools are seeing really quite dramatic changes in both directions. A sizeable chunk of schools have moved up a great deal, as well as down. But that looks to be more common for science compared to other subjects anyway. Hence, science always seems to have greater variance. If you fiddle with cohorts, it is likely to get worse.


I was getting Cs and Bs in science and when I got my results today, both my core and science results were at a D! Definitely a huge change for the science results this year!