This page is from 2016. Here’s where to look for 2017 GCSE results
GCSE results are out. What do the trends show?
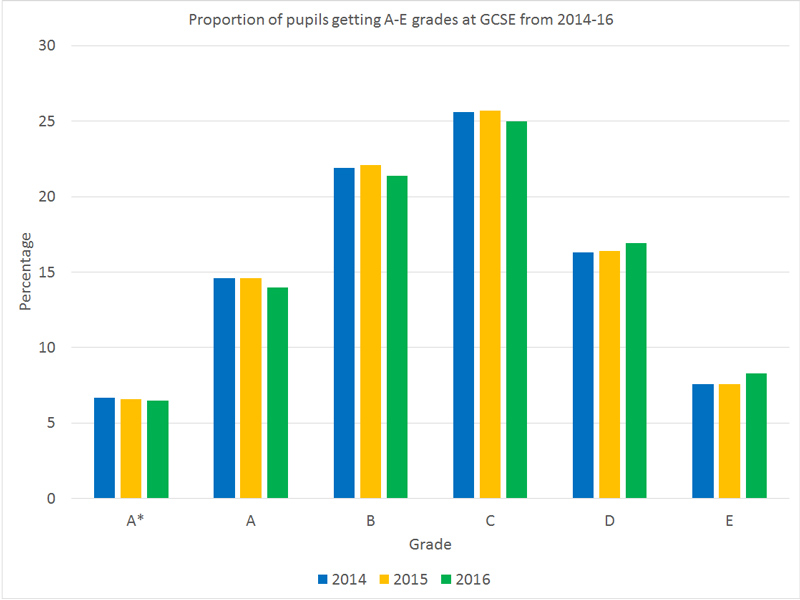
1. The proportion of 16 year-olds getting A*s and As is down 0.6 percentage points
For 16 year olds, the proportion of A*s is down 0.1 percentage points, and A*/A grades declined by 0.6 percentage points.
This year 21.7 per cent of grades were an A or A*, compared to 22.3 per cent last year.
Overall, the proportion of students get a grade (A*-G) remained stable at 98.7 per cent.
2. The A*-C pass rate for 16 year-olds also dropped by 1.3 percentage points
Across all entrants, the A*-C pass rate dropped by 2.1 percentage points but this was affected by the number of 17 year olds forced to resit GCSE maths and English.
Looking just at 16 year olds, the A*-C rate dropped by a lower percentage – 1.3 points – dropping from 70.8 per cent last year to 69.5 per cent this year.
IN PICTURES: GCSE Grade Distribution: 2015 vs 2016

4. Computing, Engineering and Construction had highest increases in entry
Computing increased its entry numbers by 76.4 per cent, increasing from around 35,500 entrants last year to around 62,500 this year.
Engineering had the second largest increase (11.7 per cent increase) and construction closely after (8.8 per cent).
5. Design Technology, French and Art & Design tumbled in popularity
Design & Technology had 9.5 per cent fewer entrants this year – dropping from around 20,500 entrants to 18,500.
French also continued decreasing for the third year in a row, with entrants falling by 8.1 per cent.
English literature also continued decreasing, with a 5.1 per cent slump in entrants.
6. Maths is the only subject in which boys outperformed girls
Female entrants had an A*-A rate 7.3 percentage points higher than male entrants, and an A*-C rate 8.9 percentage points higher.
Maths was the only subject in which boys received a higher proportion of the grades – outperforming girls by 0.7 percentage points at A*-A and 0.5 percentage points at A*-C.
Girls pulled away most significantly in Art & Design where the A*-C rate was 18.6 percentage points higher than boys.
7. Boys study computing at four times the rate of girls
The most gender imbalanced subjects this year were art and computing.
Art was most heavily skewed toward female entry – with 2 girls taking art for every 1 boy.
Computing, however, was even more heavily skewed toward male entry – with 4 boys taking the subject for every 1 girl who signed up.
Schools Week will be analysing trends throughout the day. Check back for more.


Can you please confirm whether this information is inclusive of Wales?
It is UK
What about results by school type, academy, free school and local authority school?
Referring to item 4 (computing, engineering and construction) are you able to say what the boy/girl split of entries was please?
DT has not necessarily dropped in popularity, schools are actively squeezing out creative subjects by organising option blocks so DT goes up againt the Sciences or other ‘more important’ subjects, meaning year 9 students have restricted choice.
Why are you still using the A*-C measure when that has been replaced by progress 8. A*-C is based on last years methodology and the fact that you’ll have to search very hard on the performance tables to find it confirms it isn’t really a headline figure this year. It’s perverse to use it. Also it wouldn’t be exclusively 16 year olds. KS4 data can include 14 and 17 year olds too.
From the editor: This story was written on the day of the GCSE results. Progress 8 scores are not released on the day by the government as that is a performance measure for schools, rather than a national picture. At Schools Week we inform a broad range of people outside of schools, as well as inside, which means that being able to look at national performance on a measure last year compared to this year is still important and useful. As we move forward, and there is a shift to the 1-9 grading system, this will become more difficult, but for this year it was fair and appropriate to include in the round-up.
The data is provided in different formats to newspapers, including figures which are only for pupils in Year 11. This is the data we typically use unless we mention otherwise. As you note, this is important because 17 year olds have very different pass rates in English and maths due to the changes in resits, and hence is why we are quite specific that this data is for 16 year olds only.