School census data from January 2017 has been released by the government today. Here are the main points…
1. Free school meal take-up rate falls to lowest on record
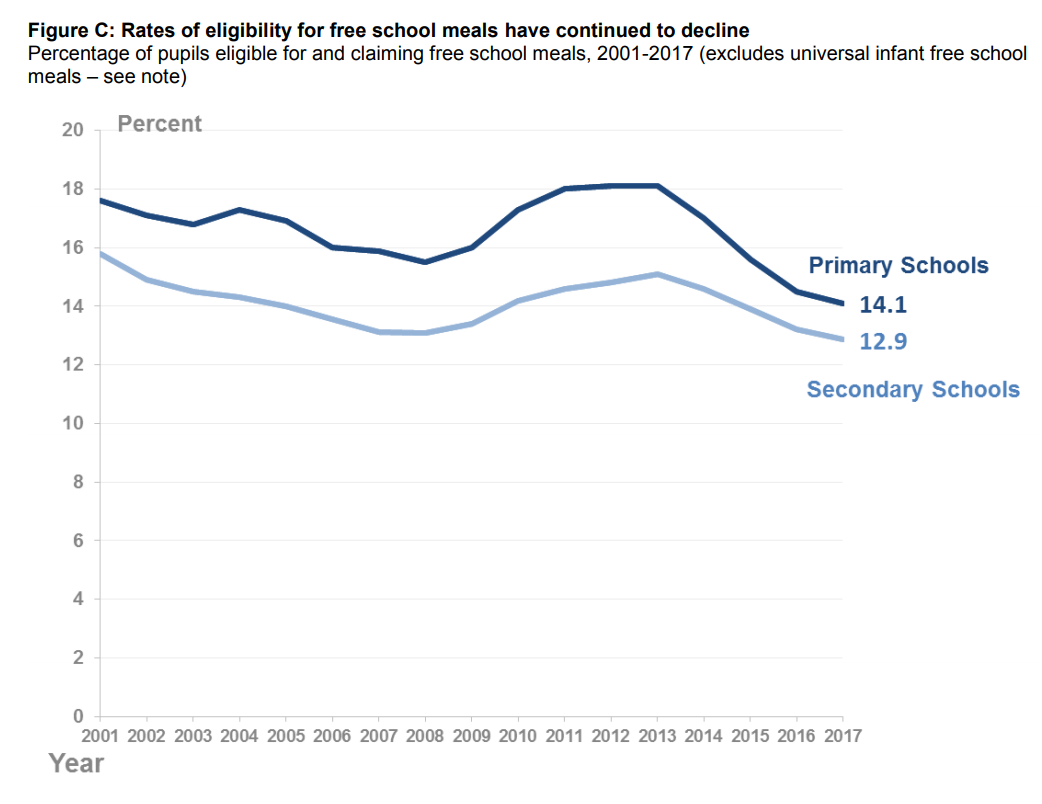
In January, 14 per cent of all pupils were eligible for and claiming free school meals, down from 14.3 per cent last year and the lowest level since records began in 2001.
In secondary schools, 12.9 per cent of pupils claimed free school meals, while 14.1 per cent claimed them at primary level.
However, the government says this is likely to be linked to a fall in the number of people claiming benefits.
Entitlement to free school meals is determined by the receipt of certain income-related benefits. As the number of benefit claimants decreases, the proportion of pupils eligible for FSM falls.
2. Fewer infant pupils now taught in large classes
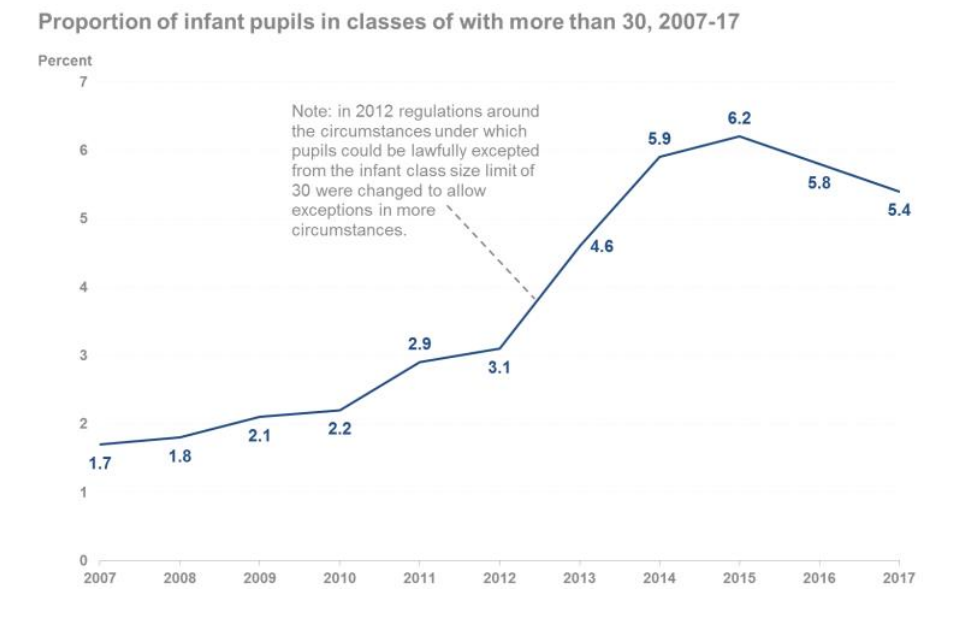
The data shows that 5.4 per cent of infants are in classes above the legal limit of 30 pupils, down from 5.8 per cent last year and 0.8 percentage points lower than the peak of 6.2 per cent in 2015.
However, the proportion of pupils in large classes is still higher than in 2013, the year immediately after new exemptions to the cap were introduced.
Of infants in large classes, more than 95 per cent were in classes of 31 or 32 pupils.
The average infant class size remains at 27.4.
3. Rise in state-funded primary and secondary schools, but drop in private schools
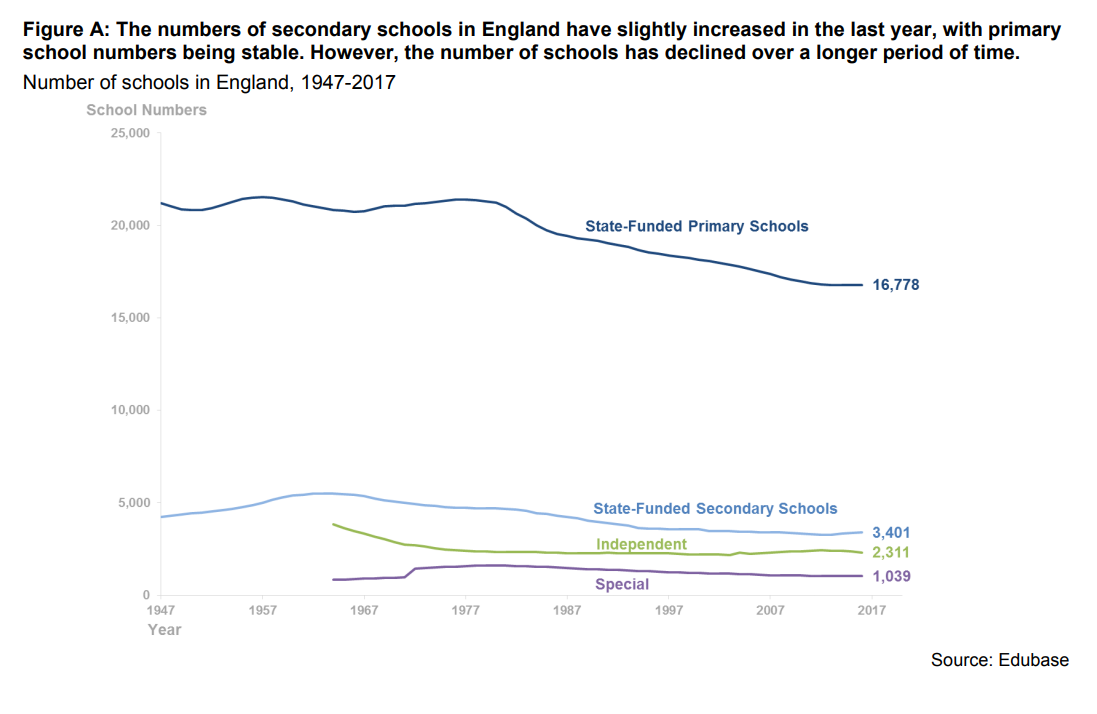
There has been a net increase of eight state-funded primary schools and seven state-funded secondary schools since January 2016.
However, there are four fewer nursery schools, two fewer special schools, two fewer PRUs and 14 fewer independent schools.
There has also been an increase in the number of all-through schools, from 141 in 2016 to 150 this year.
Schools are also getting larger. The average size of all types of school increased in 2017, with secondaries reversing recent drops in their average size.
4. Proportion of pupils of minority ethnic origins continues to rise
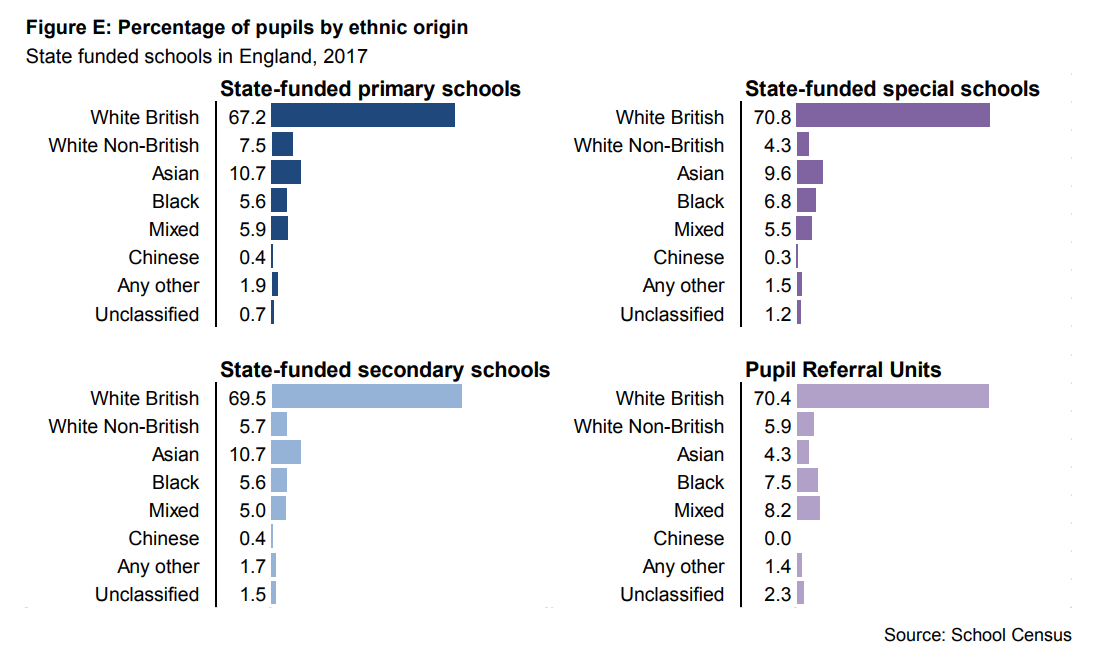
In primary schools, 32.1 per cent of pupils are of minority ethnic origins, compared to 31.4 last year.
White British children make up 67.2 per cent of primary school pupils. The second largest group is Asian pupils (10.7 per cent), while white non-British pupils (7.5 per cent) are the third largest group for the fourth year running.
At secondary, 29.1 per cent of pupils are of minority ethnic origin, up from 27.9 per cent in 2016. Of all secondary school pupils, 69.5 per cent are white British, 10.7 per cent are Asian, 5.7 per cent are white non-British and 5.6 per cent are black.
5. The proportion of English as an additional language pupils is also going up
In primary schools, 20.6 per cent of pupils are exposed to a language other than English in their home, up from 20.1 per cent in 2016.
In secondaries, 16.2 per cent of pupils are exposed to a non-English language in their home, up from 15.7 per cent last year.
However, the government points out that this is “not a measure of English language proficiency or a good proxy for recent immigration”.
The increase is largely driven by an increase in the number of children born to non-UK-born women, rather than direct current immigration.




Your thoughts