A new analysis released today from the data experts at Watchsted has attempted to shed more light on how the performance of local authority schools compares to that of academies.
The Local Government Association commissioned the study and suggested the data shows “council maintained schools continue to outperform academies”.
The organisation pointed to a finding that 86 per cent of local authority maintained schools are now rated as “good or outstanding”, compared to 82 per cent of academies.
But does this stack up? Schools Week has sifted through the report to explain the findings:
1 Are local authorities better performing?
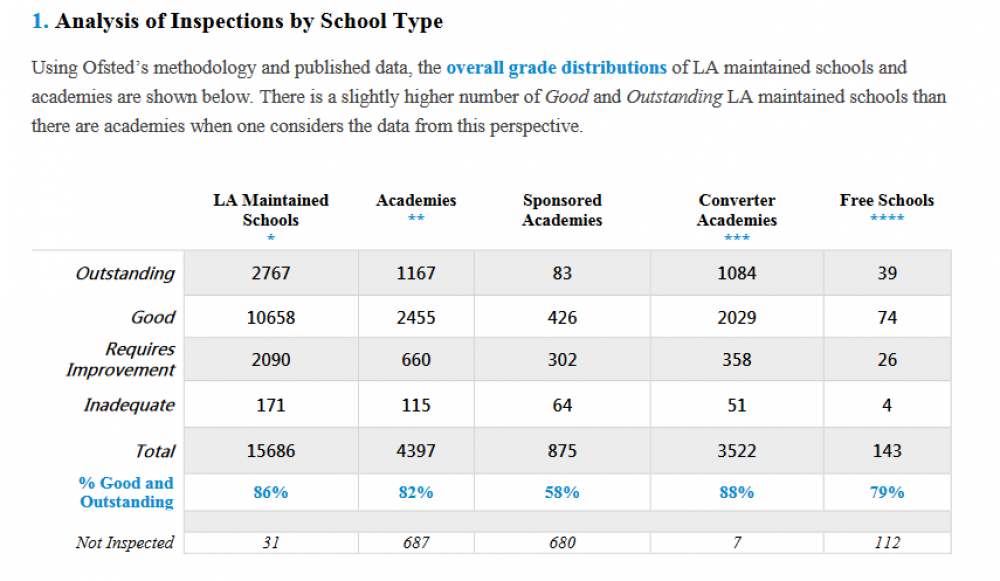
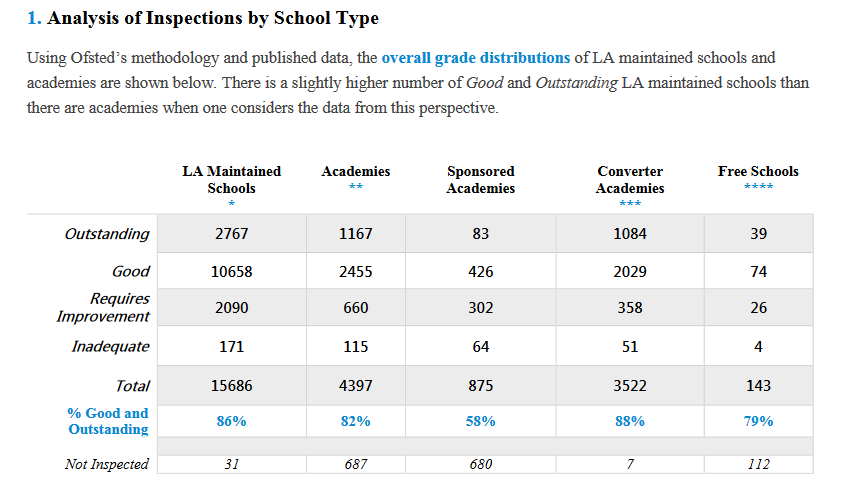
Watchsted analysed Ofsted reports by school type – here are the results:
Does this mean local authority schools are better performing? It’s not that straight forward.
As Watchsted points out, these figure are skewed by a number of factors.
For instance, when a good or outstanding school becomes a converter academy, it means the local authority set of schools will appear weaker.
And vice versa, sponsored academies are normally made up of weak and failing schools, so removing them from the local authority category means the LA stats appear more flattering.
The Department for Education also points out that a large number of sponsored academies and free schools have yet to be inspected (more than 40 per cent per each, the department said).
There are also other factors: there may be an inflation of the proportion of good and outstanding schools in aggregated figures because of the lower-frequency that Ofsted inspects these schools.
Also, from September 2012, Ofsted introduced a different set of rules to assess schools. This again impacts the comparibility.
2 The impact of becoming an academy
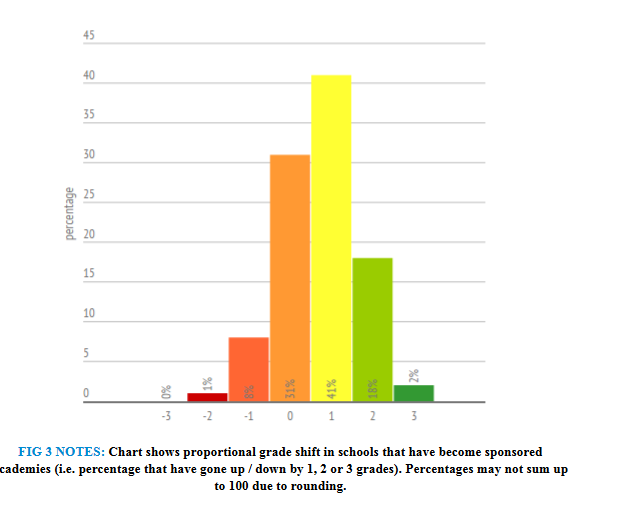
A total of 61 per cent of sponsored academies improved their grade after becoming academies. But, as Watchsted points out, this does not show whether the sponsored route is more or less effective than other strategies might have been.
3 Less improvement in secondaries
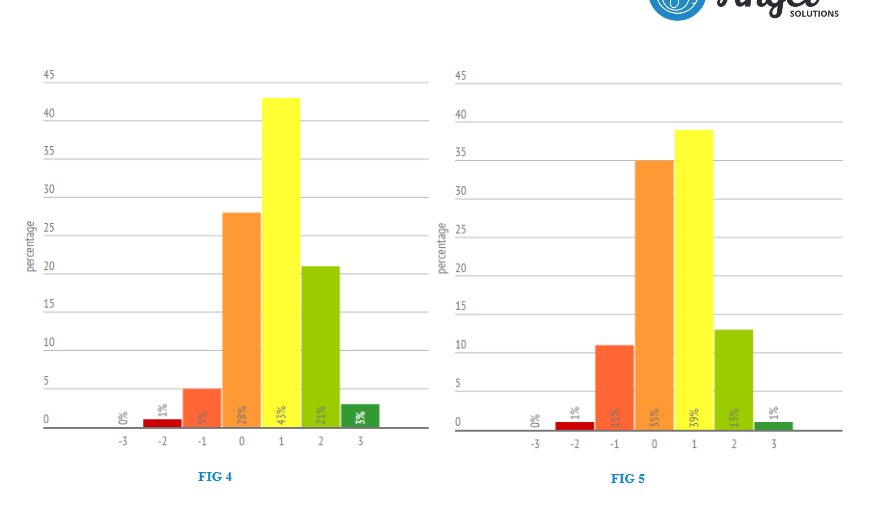
Watchsted was able to compare the impact of academisation on primaries vs secondaries. For what it’s worth, they found 67 per cent of primaries improved (left), compared to only 53 per cent of secondaries (right).
4 The improvement of inadequate schools
The Local Government Association, in its press release, pointed to recent research from Ofsted that found 88 per cent of inadequate academies improved after becoming academies, compared to 98 per cent in LA maintained schools.
But that data used the first inspection after academisation. Watchsted did the same analysis using the most recent Ofsted for sponsored academies that had been inadequate.
The result: 95 per cent of academies with inadequate predecessor grades improved their Ofsted.
5 How do the multi-academy trusts stack up?
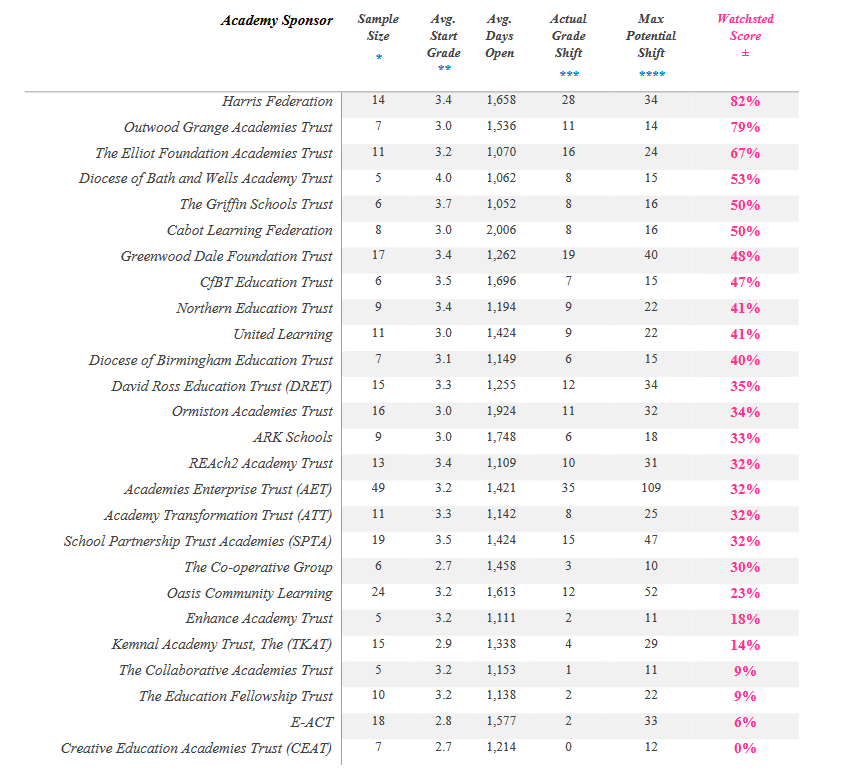
Watchsted has rated 26 academy sponsors by how much they improved Ofsted ratings in their schools.
They looked at academy trusts with at least five sponsored academies that had been inspected after becoming academies, and have a predecessor grade available.
Here’s what they found:
KEY:
Average Start Grade: The average predecessor grade; Outstanding (1) – Inadequate (4)
Actual Grades Shift: The total number of grades by which the sample has improved
Max Potential Shift: The maximum possible number of grades that the sample could have risen (i.e. if every sponsored academy in the sample had moved up to a grade of Outstanding)
Watchsted Score: The percentage gap between the actual and potential grade shift. This has been used as a performance indicator to rank each academy sponsor
What Watchsted said:
Sponsorship may have contributed towards improvement in the majority of the weakest schools, but did not benefit the majority of schools previously found to be good.
However it is not clear whether sponsorship provides a more effective path to improvement than remaining LA maintained.
There are some high-performing academy sponsors, such as Harris and Outwood Grange, however there are only a small number of high-performing sponsors and they do not cover every region of the country.
What the LGA said: 
Roy Perry, Chairman of the LGA’s Children and Young People Board, said: “These figures clearly demonstrate that councils are education improvement partners, rather than barriers to delivering the high quality education that our children deserve.
“With 86 per cent of council-maintained schools in England rated as ‘good’ or ‘outstanding’ by Ofsted, the Government needs to recognise councils’ role in education improvement, and that imposing structural changes on schools is not the best way to improve education.”
What the DfE said:
“These figures are completely misleading, and wilfully ignore the real progress that’s been made through removing the very worst performing schools from council control and turning them into sponsored academies…
 “The latest inspection results show 350,000 children now study in sponsored academies rated ‘good’ or ‘outstanding’ – previously these schools suffered from chronic underperformance, blighting the life chances of young people and preventing them from achieving their full potential.
“And academies have made substantial progress with results in primary sponsored academies open for two years improving at around double the rate of maintained schools over the same period. For secondary sponsored academies, we’re seeing recently opened schools bettering their performance year-on-year.”




So DFE are calling the LGA stats wilfully misleading. Well if that’s not the pot calling the kettle black I don’t know what is! They correctly point out that some poorly performing schools have converted while conveniently forgetting that most of the voluntary converters were good or outstanding schools. They constantly compare the performance of converters with all LA schools and other tricksy stats. Only last week Nick Gibb was caught out saying all schools would be converted by 2020 anyway, which was an outright lie given the very small proportion of primary converters. People in glass houses really shouldn’t throw stones!
The DfE continues to treat readers as if they are stupid. The rate of improvement for schools with a low starting point (as sponsored academies usually do) will be greater than the rate of improvement in schools where achievement was already high.
Offset against the figure of 350,000 children in sponsored academies judged good or better are the number of children in non-academies which have been upgraded to good or better. Ofsted figures from December 2015 showed where sponsored academies had replaced inadequate maintained schools, 12 per cent remained inadequate. But only 2 per cent of inadequate non-academy state schools received the bottom rating when Ofsted returned.
I see that they are still using that “open for two years” sub-set. Isn’t that “completely misleading” as it “wilfully ignores” schools that have been open longer than two years as an academy? Perhaps there’s an initially positive response to change which disappates after two years?
Why don’t the LGA and schools week use Ofsted’s own published data? The excel file published a few weeks ago provides a better version of this analysis. https://www.gov.uk/government/statistics/maintained-schools-and-academies-inspections-and-outcomes-as-at-31-december-2015