The EBacc has prompted a rise in pupils taking at least one arts subject at GCSE – but the number of teachers and contact hours dedicated to those subjects have fallen, because schools have “misunderstood” the EBacc, according to a new report.
Concerns from cultural organisations that the five EBacc subjects – English, maths, science, a language and history or geography – have “stifled” arts subjects have been “put to rest” by a new analysis of data, says a report by New Schools Network, a charity which supports free schools.
Almost half of pupils took at least one arts subject in 2016, compared to 44.7 per cent in 2012, they found.
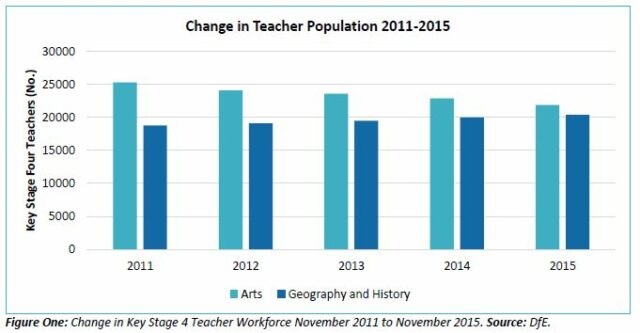
But the number of arts teachers at key stage 4 has dropped – meaning more pupils are taking arts subjects with fewer teachers.
The findings put to rest arguments that EBacc policy is stifling cultural education
And the number of teaching hours dedicated to arts subjects at key stage 4 has also fallen. By comparison, the number of geography and history teachers and their contact hours have risen.
Notably, the number of pupils taking arts subjects only rose overall if design and technology was not included as an arts subject.
Russell Hobby, general secretary of the National Association of Head Teachers (NAHT), said that less than 40 per cent of pupils in a cohort were taking the EBacc, far short of the government’s 90 per cent target, meaning “we have not yet seen the full impact of this policy.”
“Driving more pupils into taking EBacc will negatively affect the number of arts and technical and vocational GCSEs pupils can take, and will narrow their subject choices.”
Nearly 80 per cent of secondary school leaders said in a recent NAHT survey that the EBacc had a negative impact on the curriculum theoffer in their school.
The report analysed entries for art and design, dance, drama, expressive and performing arts, media and music. It looked at the Department for Education’s (DfE) annual key stage 4 subject and qualification data releases for the five academic years from 2011-12 to 2015-16.
School workforce data was also analysed to see the number of teachers by subject and the breakdown of total hours taught each week.
Here are six further findings Schools Week has pulled from the report:
1. More pupils have entered arts subjects since the EBacc
“Despite the introduction of the EBacc”, GCSE entries to arts subjects rose by 6,318, or two per cent, to reach 320, 736 entries.
And the proportion of pupils in state schools taking at least one arts subject increased from 44.7 per cent in 2012 – the first full academic year after the EBacc was announced – to 48 per cent in 2016.
2. But numbers of teachers and teaching hours have dropped
The number of arts teachers dropped by 13.4 per cent, from 25,300 to 21,900, at key stage 4 level between 2011 and 2016.
By contrast, the number of geography and history teachers increased by 8.5 per cent.
And teaching hours for arts subjects also fell by 16.4 per cent. Meanwhile geography and history saw a 22.9 per cent increase in teaching time.
“It does appear that schools have misunderstood the intention behind the EBacc, using its introduction to reduce funding for the teaching of the arts,” said the report.
It added the government “must shoulder some of the blame for this misunderstanding and should do more to signal its enthusiasm for arts education.”

3. Independent schools have entered fewer pupils to arts subjects
Since the introduction of the EBacc, the number of GCSE arts entries in independent schools has dropped by 12.9 per cent.
That’s a decline of 3,787 entries. The new GCSE accountability measures “do not apply” to independent schools, noted the report.
4. If design and technology was included, entries to arts subjects would have fallen
“It’s possible to show a decline in the total number of arts GCSEs being taken since 2011-12” if design and technology is counted, the report said.
It would be “unconventional” to consider design and technology an arts subject, as it involved topics such as electronics and resistant materials, said the author.
It comes as the government managed to recruit only 50 per cent of the required design and technology teachers onto its fee-paying School Direct course last year, and less than 50 per cent onto higher education PGCE courses.
5. Deprived areas have seen a greater rise in entries to arts subjects
Arts entries per pupil rose 5.9 per cent nationally between 2011-12 and 2015-16.
But those arts entries per pupil rose by 16.1 per cent in areas of “heightened deprivation”.
6. Arts subjects are better for Progress 8 and Attainment 8 than other subjects
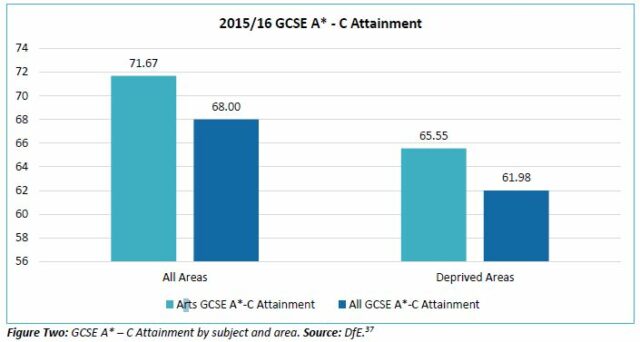
The report found that grades in the arts subjects “consistently outranked” those of other subjects.
Just 68 per cent of GCSE entries in non-arts subjects attained an A* to C grade.
But in arts subjects, that attainment was higher at 71.7 per cent achieving an A* to C in 2015-16.
“Because grades in arts GCSEs are typically higher, arts GCSE add more to Progress 8 and Attainment 8 scores than other subjects.”

Writing in the foreword, Nick Gibb, minister for schools, and Matt Hancock, minister of state for digital and culture, said “the findings of this report put to rest arguments that EBacc policy is stifling cultural education.”
Restricting the EBacc to five subject areas had been a “deliberate decision” to allow pupils to pursue a “number of other subjects, including the arts”, they added.
Toby Young, director of New Schools Network and founder of the West London Free School, said “nearly all” arts organisations believed that that introduction of the EBacc had a “devastating impact” on arts education – but the new findings proved this view wrong.
However the Bacc for the Future campaign group said there is “clear evidence that the EBacc is having a negative impact on the uptake of arts subjects”.
“Research and evidence on the decline in hours taught and staffing levels in these critical areas has been published,” they added.


Could Schools Week publish the raw data please.
I have visited the New Schools Network report and it does not include the raw data. The fact that Arts entries have dropped in independent schools whilst increasing in state schools with Arts teacher numbers falling is frankly against the laws of common sense. How can more students take Arts subjects with fewer teachers?
As Victor Meldrew might have said, “I just don’t believe it”. Perhaps you could ask an independent expert like Warwick Mansell to run his eye over the figures, providing New Schools Network will let anyone see the figures.
If the figures are correct, the strategy for saving Arts subjects is easy. We just fire all Art teachers and the number of students taking Arts GCSEs should rocket.
Here’s the link to the NSN report. It contains a foreword signed by Schools Minister Nick Gibb and Matthew Hancock, Minister of State for Digital and Culture. This is a puff for Government reforms since 2010. Whether this inclusion in a document published by a charity breaches charity rules re lobbying is debatable.
http://www.newschoolsnetwork.org/sites/default/files/NSN%20Arts%20Report%20-%20The%20Two%20Cultures_0.pdf
Figures from Ofqual confirm there was a rise in GCSE entries from 2012 to 2015 in Art and Design (NB this does NOT include Design and Technology) and Music. But the trend reversed in 2016: Art and Design declined by 5% and Music by 3%.
Drama entries declined in 2013 (1%), rose by 2% in 2014, fell by 1% in 2015 and fell again by 4% in 2016.
Media/Film/TV dropped by 5% in 2013, rose by 7% in 2014 only to fall again by 3% then 15% in 2016.
Performing and Expressive Arts fell year on year: 2013 -3%, 2014 no change, 2015 -1%, 2016 -11%
Dance, which is listed separately in the NSN report, doesn’t appear as a separate subject in Ofqual data.
This appears to suggest a downward trend. However, these figures include those for independent schools and it may be, as NSN says, that there is no decline if independent schools are omitted. I’ve no way of checking.
Ofqual tables can be downloaded from Ofqual. I haven’t included the links because multiple links mean comments get stuck in moderation.