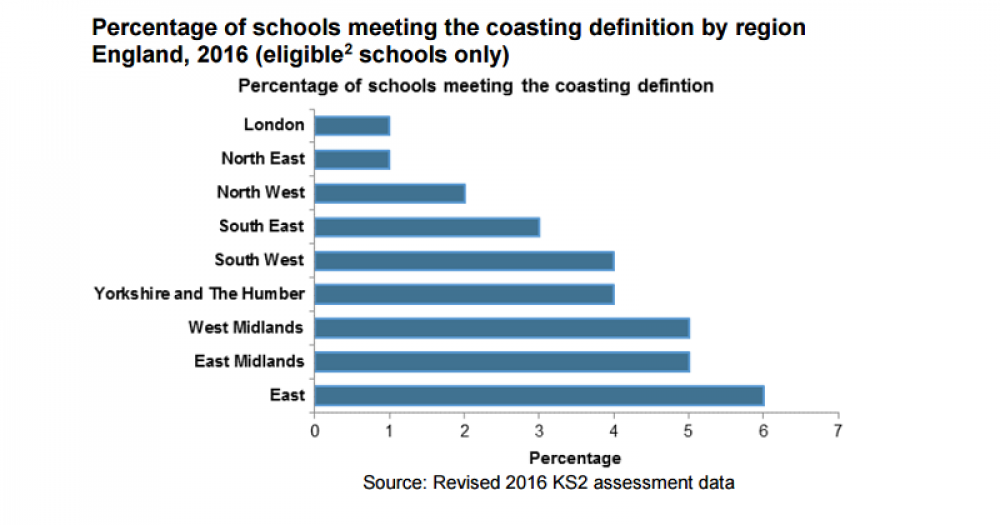
The east of England has the highest proportion of coasting primary schools, while London and the north east have the lowest, new government figures have revealed today.
Updated key stage 2 data released this morning shows that 83 of the 1,505 primary schools (6 per cent) in the eastern region are defined as ‘coasting’, making them eligible for intervention and potential forced academisation.
In contrast, just 1 per cent of schools in London and the north east are coasting, while the west and east midlands have the second highest proportion of coasting schools, with 5 per cent in each.
The release, an update to revised key stage 2 national assessment statistics, also shows that 477 primary schools have been identified as meeting the government’s definition of coasting in 2016.
According to the government, there is also an overlap between the number of schools falling below the floor standard and the number falling within the coasting definition.
Of 665 primary schools that were below the floor standard, 109 are also coasting.
The new regulations which officially define coasting schools came into force yesterday. A move by the last government to clamp down on schools considered to be coasting was passed by parliament in 2016 as part of the education and adoption act.
It was revealed last year that more than 800 secondary schools also face being labelled as coasting based on their progress 8 scores.
Former education secretary Nicky Morgan said that the coasting intervention would target schools failing to push every pupil to reach their potential, particularly those in “leafy areas with more advantages than schools in disadvantaged communities”.
Once a school is classed as coasting it will be assessed by the regional schools commissioner, who will decided whether the school has a “credible plan” to improve.
Schools deemed unable to improve will face being converted into academies, or rebrokered if the school is already an academy.
Here are the top 10 and bottom 10 local authority areas by percentage of schools which are coasting…
Top 10
| Local authority | Total schools | Total coasting | Percentage coasting |
| Poole | 17 | 4 | 24 |
| Luton | 38 | 7 | 18 |
| Bedford | 20 | 3 | 15 |
| Southampton | 42 | 6 | 14 |
| Bournemouth | 24 | 3 | 13 |
| Dorset | 96 | 12 | 13 |
| Derby | 55 | 6 | 11 |
| Kirklees | 104 | 10 | 10 |
| Medway | 58 | 6 | 10 |
Bottom 10
| Local authority | Total schools | Total coasting | Percentage coasting |
| Stockport | 79 | 1 | 1 |
| Warrington | 67 | 1 | 1 |
| Calderdale | 78 | 1 | 1 |
| Sheffield | 112 | 1 | 1 |
| Wakefield | 100 | 1 | 1 |
| Leicester | 69 | 1 | 1 |
| Lincolnshire | 211 | 3 | 1 |
| Kent | 394 | 4 | 1 |
| Oxfordshire | 202 | 3 | 1 |
| Devon | 225 | 2 | 1 |


There has been an Education Elite created to replace the Local Authority
Most of the regional directors recruiting from their Old Boys Network They all know each other and seem to be totally in each others pockets Harsh but true.
Prior to Christmas we were a coastal school but the New Year sees us moving to newly classified Coasting. The letter our school has received is designed to be threatening and interestingly is coped to Ofsted.
I understood that the DFE and Ofsted are meant to be separate entities …No more it would seem. If you show the side kicks of the regional inspector around, every part of the conversation that is held will be reported back to the inspector and after 50 minutes of discussion every shred of conversation that they can glean will be used against your school.There are no reports written just here say evidence which results in the school being bullied into becoming a MAT