More than half of established multi-academy trusts fell “significantly below” the average for pupil progress, with a host of the country’s largest trusts among the worst performers at secondary level.
The government has today published its multi-academy trust (MAT) performance league tables, based on 2016 exam results.
The analysis is based on key stage 2 and key stage 4 exam results, and only includes trusts running at least three schools and which have been established for three or more years.
The results of special and alternative provision schools in trusts are not included in the figures.
The release follows the first MAT league tables, based on 2015 performance, published last year.
Schools Week has pulled out the top findings. (And do make sure to read to number 6 – that’s the one that made us say ‘wow’).
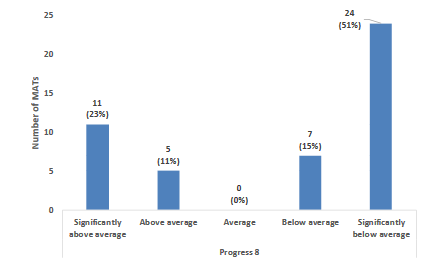
1. Over half of MATs ‘significantly below’ Key Stage 4 average
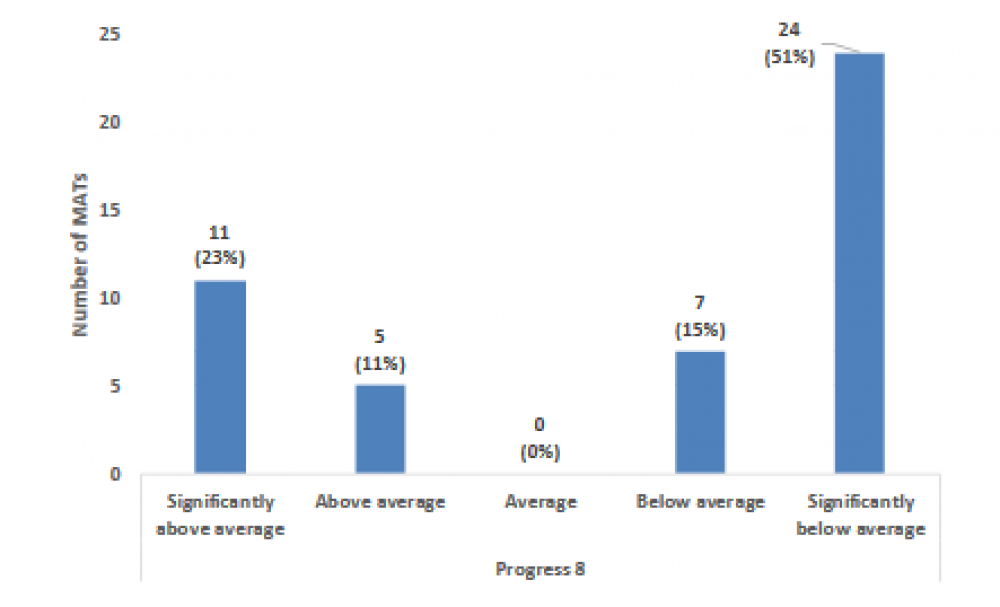
The data shows that two thirds of MATs posted Progress 8 scores that were below average at key stage 4. Just over half of those (51%) performed “significantly below” average.
But the government says this needs to be taken with a pinch of salt.
The report states the measure does not fully account for the historic performance of schools – such as those with poor prior performance that became sponsored academies (which account for more than three-quarters of the academies in these results).
2. Slightly better news for MATS at Key Stage 2
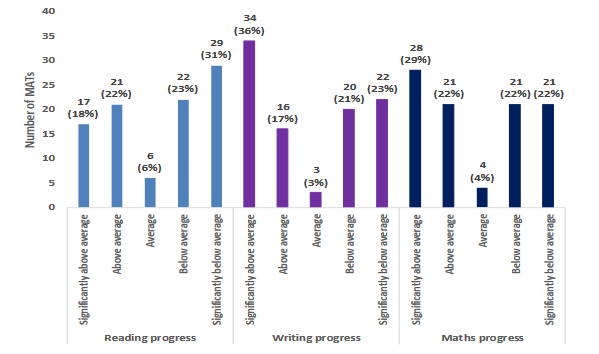
MAT performance at Key Stage 2 seems to have fared better. The data shows that more than half of MATs had above average progress in writing and maths.
However, results are not so good on reading: more than half of the MATs had scores that were below average.
But the analysis does show that fewer academies in the KS2 category (50 per cent) are sponsored academies.
So, using the government’s above caveat, the lower number of historically poor-performing schools among the data could account for MATs having better scores.
3. Lowest-performing MATs include host of larger trusts
Schools Week has analysed the data to draw up our own MAT league tables.
At key stage 4, the worst performers are those that scored “significantly below” average for both pupil progress and value added.
Our findings show that some of the country’s largest trusts are ranked at the bottom of the table. They included Academies Enterprise Trust, the largest trust in the country with 66 schools, Ormiston Academies Trust (31 schools), and E-ACT (24).
At key stage 2, trusts had to be “significantly below” average on all three of the maths, reading and writing scores, as well as value added.
The trusts in this list include Ninestiles Academy Trust, formerly headed by Christine Quinn before she was appointed regional schools commissioner for the West Midlands.
Worst performers at Key Stage 4 (in alphabetical order):
Academies Enterprise Trust (AET)
CfBT Education Trust
E-ACT
Grace Foundation
Greenwood Academies Trust
Learning Schools Trust
Ormiston Academies Trust
Stoke-on-Trent College
The Midland Academies Trust
UCAT
Woodard Academies Trust
Worst performers at Key Stage 2:
Blyth Quays Trust
Ninestiles Academy Trust
The Education Fellowship Trust
4. Trusts regularly lauded by ministers make up top performers
Schools Week’s KS4 MAT league table top performers, unsurprisingly, include some of the trusts regularly praised by ministers for their performance – such as ARK, Harris and Outwood Grange.
The latter two also feature in the Key Stage 2 high fliers.
The best performers were those who scored “significantly above” on both pupil progress and value added.
Best performers at Key Stage 4:
ARK
Harris
City of London Corporation
Diocese of London
Diocese of Westminster Academy Trust
Outwood Grange
Best performers at Key Stage 2:
Harris
Outwood Grange
The Central Learning Partnership Trust
Tudhoe Learning Trust
5. Most secondary trusts with poorer pupils perform way below average
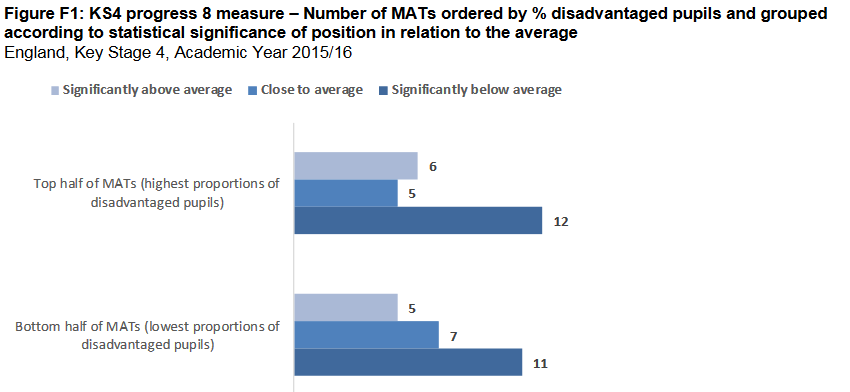
The analysis found a “relatively high proportion” of MATS with higher percentages of low-income pupils at Key Stage 4 performed below average.
However, six MATs with more low-income pupils did perform well above average – but they are not named in the government release. (We think they are Ark, City of London Corporation, the Dicoese of London, Harris, Outwood Grange and United Learning, as both have high progress 8 scores and higher percentage of pupils on free school meals).
This finding is reversed at Key Stage 2, though. A “relatively substantial proportion” of the MATs with the most disadvantaged pupils performed above average in writing and maths.
Reading was anomalous, however. Of the MATs with a larger proportion of disadvantaged pupils, eight performed above average, while 20 were below average.
6. MATs with a mix of academies seem to perform better
The government also looked at the type of academies in MATs and their performance.
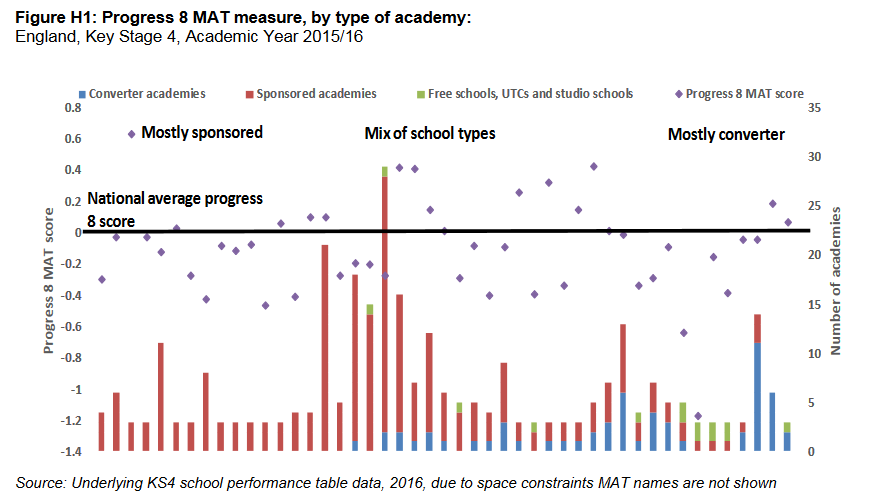
For Key Stage 4, this showed that most MATs solely with sponsored academies performed below average on pupil progress (71%).
Interestingly, the 11 MATs with mostly converters (good or outstanding schools that converted) performed even worse – 9 out of the 11 were below average (82%).
The figures are better for MATs with a mix of school types (although these have a majority of sponsored). Ten of the 19 (52%) had above average pupil progress.
At Key Stage 2, MATs comprised solely of sponsored academies posted “relatively low” educational performance scores based on the progress measures.
Save
Save




Nothing on statistically significant sample sizes here? The Ninestiles MAT is only 4 primary schools! Also, nothing about the length of time that the schools have been run by the trusts?
It’s articles like this which will dissuade successful chains from taking on the schools that need them the most…
Couldn’t agree more (see my longer-winded comments below). Think this probably summarises it better though !
Oh, my! Time for the government to invent a new kind of school to solve the nation’s educational problems. Grammar schools – that should do it. No, I know they’re not new but they’ll have to do till we can come up with something different.
I wonder if SchoolsWeek (and a large proportion of the rest of the education media) understand how they contribute to the problem.
On the one hand they bemoan how MATs are unwilling to take on “toxic schools”, and that they cherry pick the successful schools leaving behind any school that is challenging.
Then on the other hand, the moment any statistics come out that can be used to bash MATs for performing poorly they jump on them with undisguised glee. So if this is the case why on earth would a MAT take on a challenging school that is going to take several years to turn around? Surely a much better strategy is to only take on high-performing schools so as to avoid the regular uninformed witch hunts.
Without context articles like this are not helpful and in fact damaging, not only to academy trust chains (who can probably deal with it), but to those challenging schools who may not be taken on by MATs in the future because they see what happens when you have schools that don’t magically become better overnight.
Check definition of “average.” Fifty percent will always be below that.