Please note: the GSCE results tables for 2018 will be available here from 9:30 am on Thursday, 23 August, 2018.
Now that the GCSE results are out, here are the trend tables for England, showing whether results have gone up or down since 2015 – for all subjects combined, and for individual subjects.
As the GCSE system is in a period of transition, comparing grades with previous years will be tricky for the next three years, so at the bottom of the page we’ve included an explanation of how we’ve presented the data.
Note: We have used data for England only (all ages) for all subjects except English and Maths – for which we have used data for candidates aged 16 in the UK. This is due to differences in the data made available by the JCQ on results day.
25 August: For the ‘all subjects except English and Maths’ charts on this page below, we replaced the England (all ages) data with England (age 16) data at 2pm on 25 August, to provide a more useful national comparison for schools.
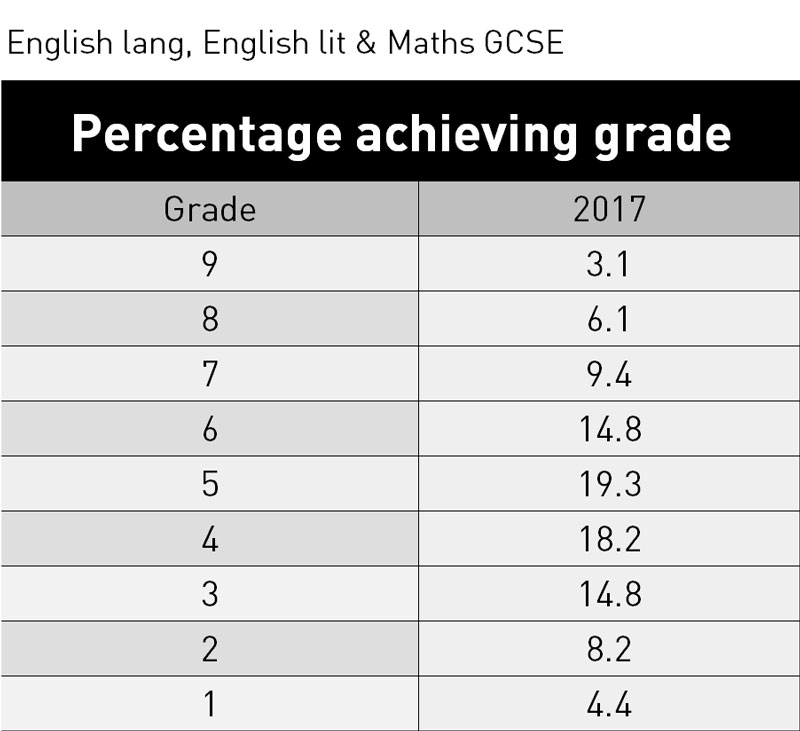
English and Maths GCSE results 2017 – UK – candidates age 16
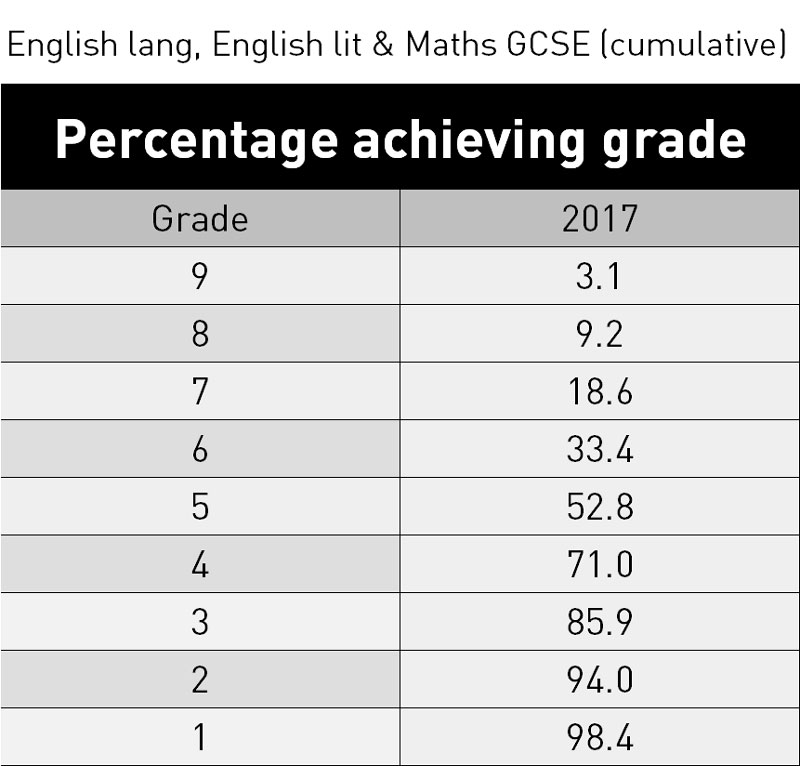
English and Maths GCSE results 2017 – UK – candidates age 16 (cumulative)
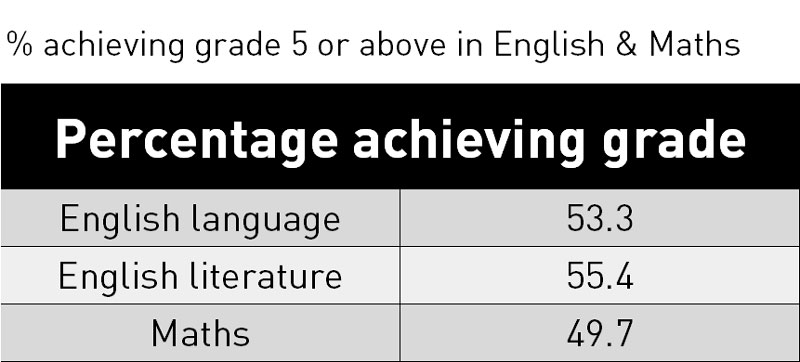
Percentage achieving grade 5 or above in English language, English literature and Maths – UK – age 16
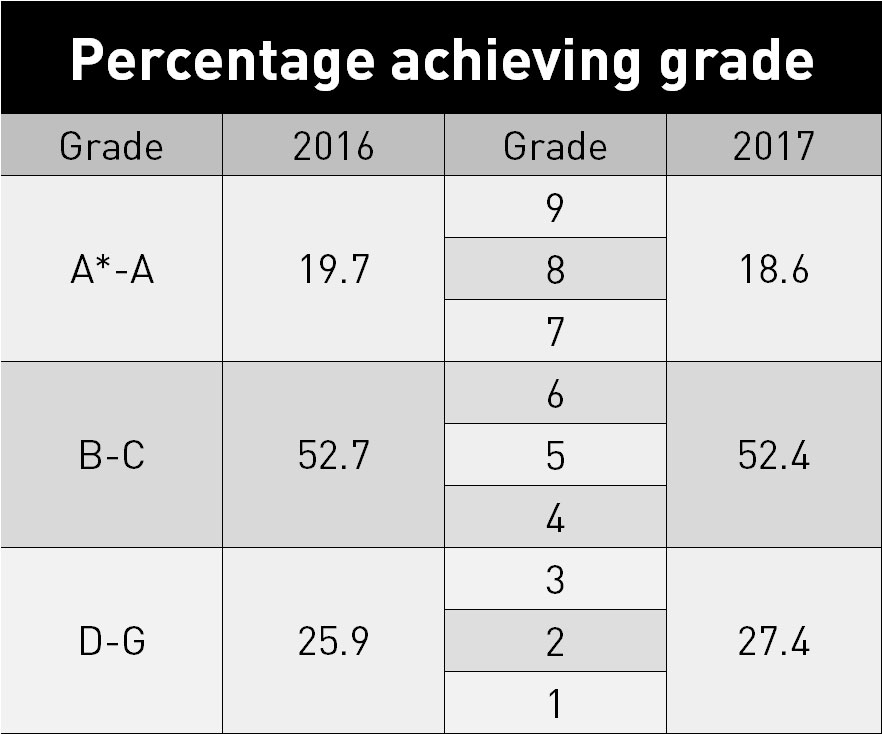
English and Maths (banded) GCSE results 2017 compared with 2016*
*The 2016 figures are for England; the 2017 figures are for the UK. However, the 2017 include very few entrants from outside England as state schools in Wales and Northern Ireland have not adopted the new GCSEs. Both are for 16-year-olds (year 11) only – so excluding resits and early entries.
**This table was updated at 16:25 on 15 August using the 2016 data for 16-year-olds only.
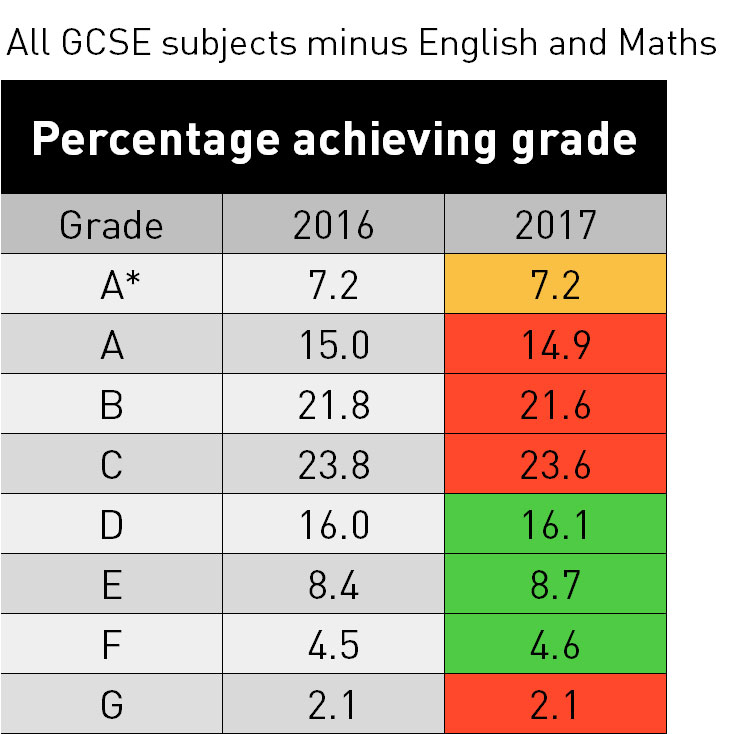
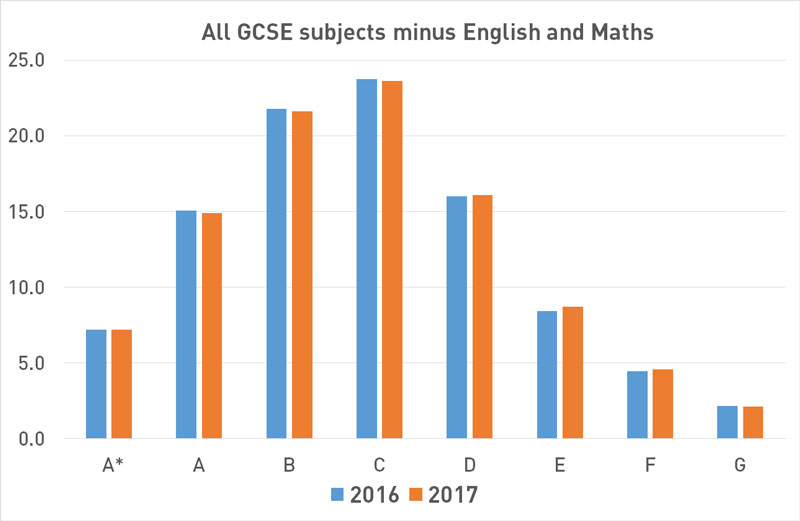
GCSE results compared with previous years: all subjects except English and Maths* – England (age 16)
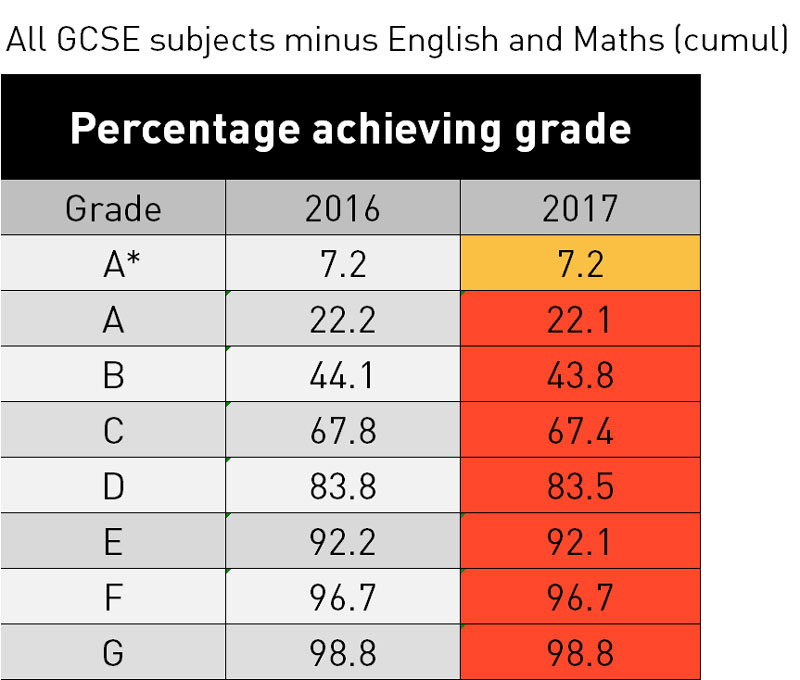
N.B. The charts in this section were updated on 25 August to reflect England age 16 results only. The 2017 data originally used was for England all ages, which included Maths and English resits.
*To create this comparison, we have subtracted the number of students achieving each grade in English and Maths from the total number of students achieving in grade in ‘all subjects’ for previous years, then recalculated the percentage without English and Maths.
GCSE results compared with previous years: all subjects except English and Maths (cumulative) – England (age 16)
2017 GCSE results tables, by subject
Click to view these subjects:
Maths
English language
English literature
Art and design
Additional science
Biology
Business studies
Chemistry
Computing
DT
Drama
French
Geography
German
History
ICT
Media & film studies
Music
PE
Physics
Religious studies
Science
Spanish
For the full subject tables, please visit the JCQ website
How do the old GCSE grades correspond to the new ones?
In 2017 Maths, English language and English literature GCSE have moved from the A*-G grading scheme to a new system of 9-1 (where 9 is the highest), though the new numbers don’t correspond exactly with the old letters.
While this means we can’t compare individual grades, Ofqual have handily named certain grades as “tie points”, so we can make comparisons between bands of grades (see chart on the right – click to expand).
The “5 or above” KS4 headline measure
The percentage of pupils achieving a 5 or above in English and Maths will be one of the new key stage 4 headline measures for 2017 – along with Progress 8, Attainment 8, Ebacc and destinations (see below).
This is why we have also included those figures for English and maths, as a national percentage. And remember that while we are able to report these figures only for each subject, the headline measure requires an individual pupil to achieve a 5 or above in both. The national headline measures will be published in January 2018.
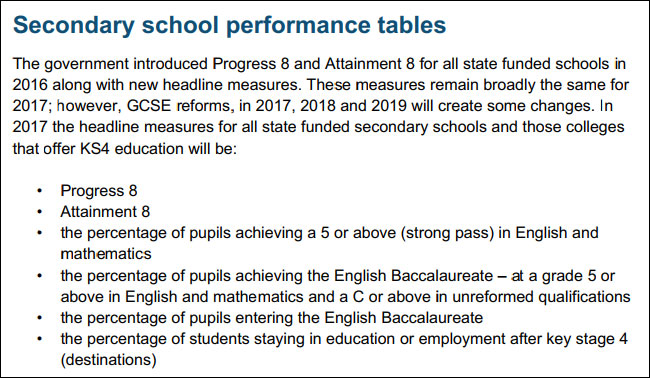
Justine Greening has labelled the new grade 5 a “strong pass” – as opposed to a 4 which is consider a “standard pass”. If you’re confused, here’s a useful explainer of the whole GCSE pass-rate question.
Which countries do we report GCSE results for?
As the systems in the devolved countries are deviating increasingly each year, we’ve decided to only include the figures for England in 2017. While the numbers of GCSE entries for Wales and Northern Ireland probably aren’t large enough to skew the data, since they are no longer comparable – and since Schools Week covers the school system in England – it doesn’t make sense to continue including them. However, where JCQ has not provided breakdowns for England only, we’ve used data for UK (e.g. with the new 9-1 graded GCSEs, where most candidates will be in England in any case).




Your thoughts