GCSE results are out.
Each year Ofqual produces boring-sounding variability charts. It sounds dull but they show how many centres, i.e. schools or colleges, dropped or increased their results compared with the previous year.
This means that if you dropped, say, 25 per cent in one subject, you can see how many other schools also saw the same dip.
GCSE English: A picture of stability
DO NOT PANIC. These look complicated, but they’re not.
The chart on the left compares this year’s results in each school to last year. Each bar shows how many ‘centres’ had an increase or decrease in their 4+ rate.
For example, go along the bottom of the graph to -10 and you’ll see the purple bar goes up to around 180. This means that around 180 schools/colleges saw a decrease in their overall 4+ rate of 10 percentage points. If you saw a similar drop – then you’re not alone, but you are unusual. Most centres only moved between -2.5 and 2.5 percentage points either way.
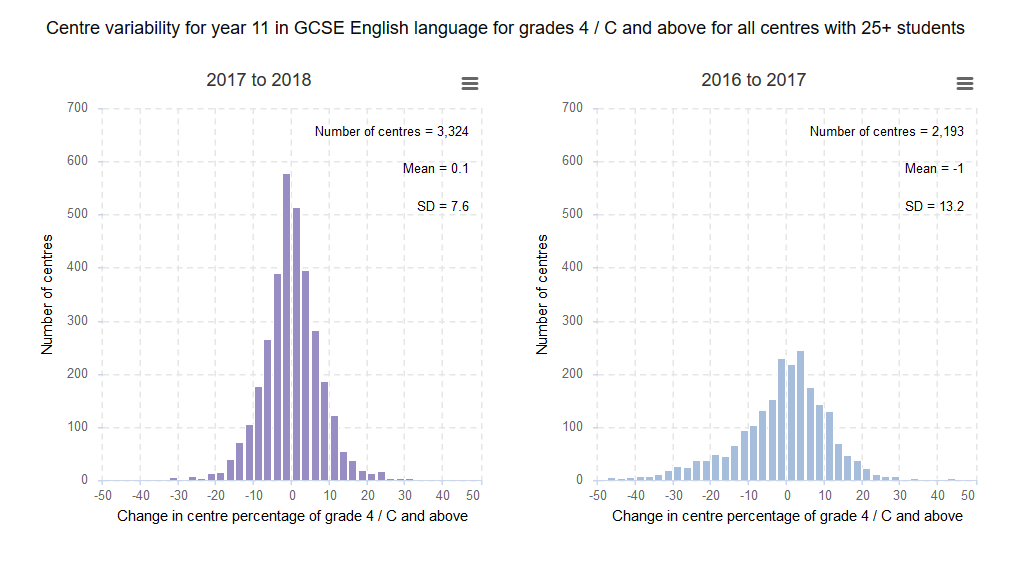
The chart on the right shows how many centres changed their results dramatically last year.
Because last year was the first go at the new GCSEs, a lot more schools decreased dramatically and the spread of results was much higher (that’s what the ‘SD’ score shows in the top right). This year, however, there is a lot more stability – which is why the SD rate has dropped.
English literature
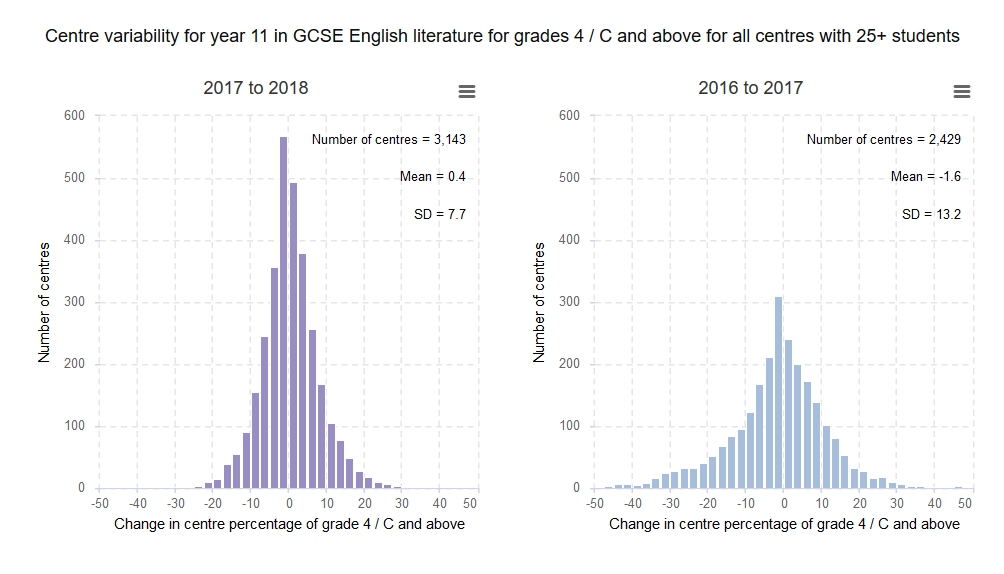
In English literature, we see the same trend. Lots of stability this year, and far fewer schools dramatically increasing or decreasing their 4+ rate.
GCSE Maths: No surprises
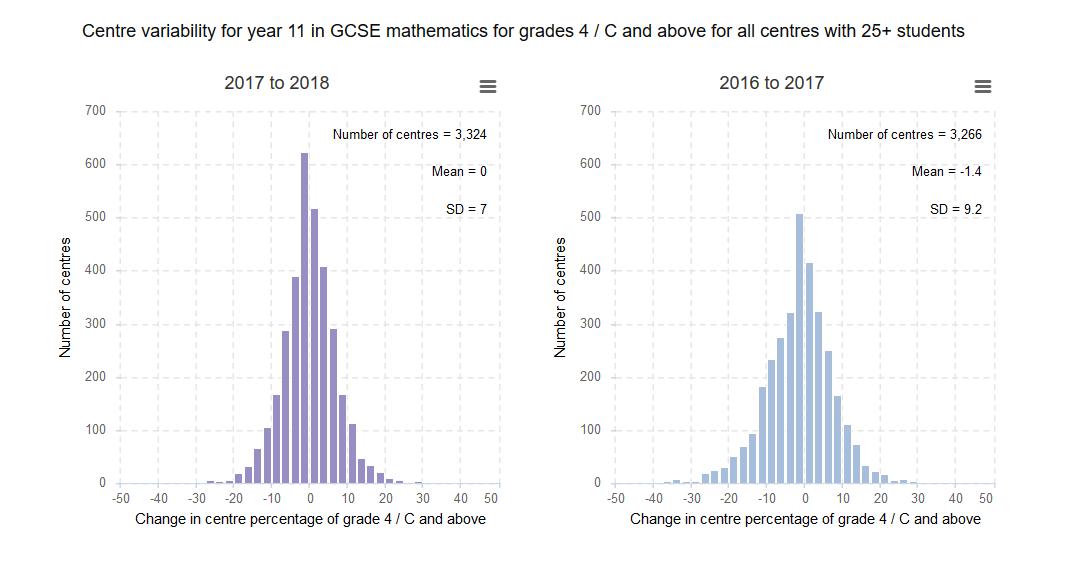
The average change this year was 0%
Whereas last year, the average centre saw its results go down by 1.4 percentage points, this year they’ve stayed pretty much the same, and there is even less spread in increases or decreases than previously. If your results increased or decreased by more than 10 percentage points you are in an elite club of about 400 schools (200 either way).
GCSE Science: Triple vs Double
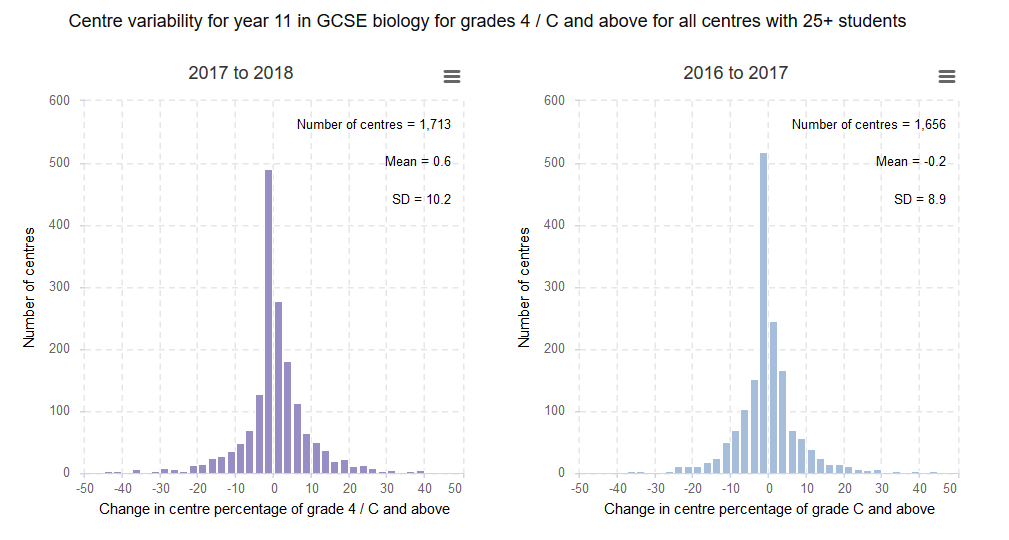
The triple science graphs all look weirdly like they did last year. This is the biology one as an example – but the chemistry and physics ones are the same. If you are seeing a centre variation of more than 7.5 either way, you’re pretty unusual.
Combined science is a whole other story!
Lots of change this year – with a mean shift of +3.6 percentage points for each school. If your combined science grades therefore look unusually positive, you are also not alone.
In part this is because there is so much change in the new science reforms and also because there has been a lot of switching qualification types.
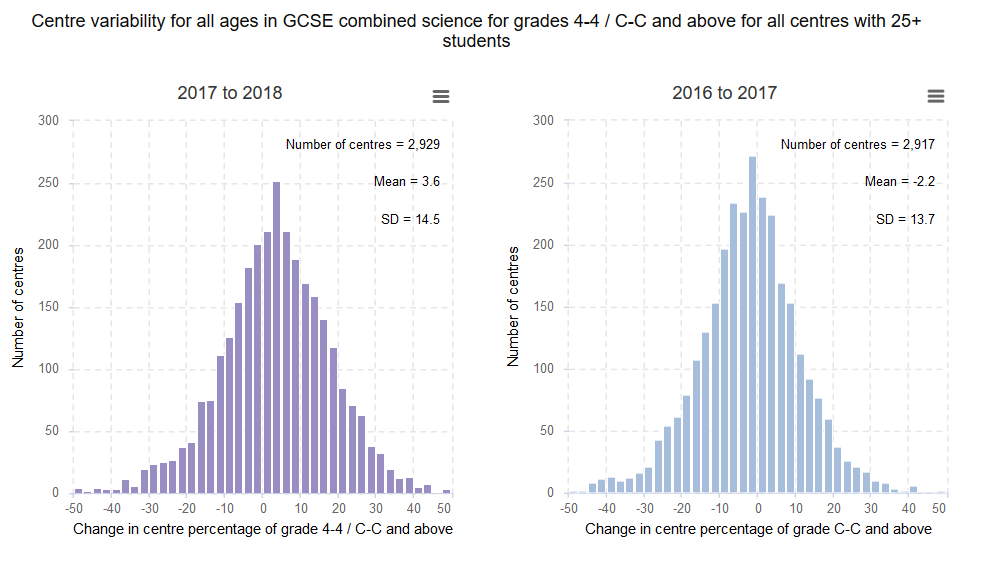
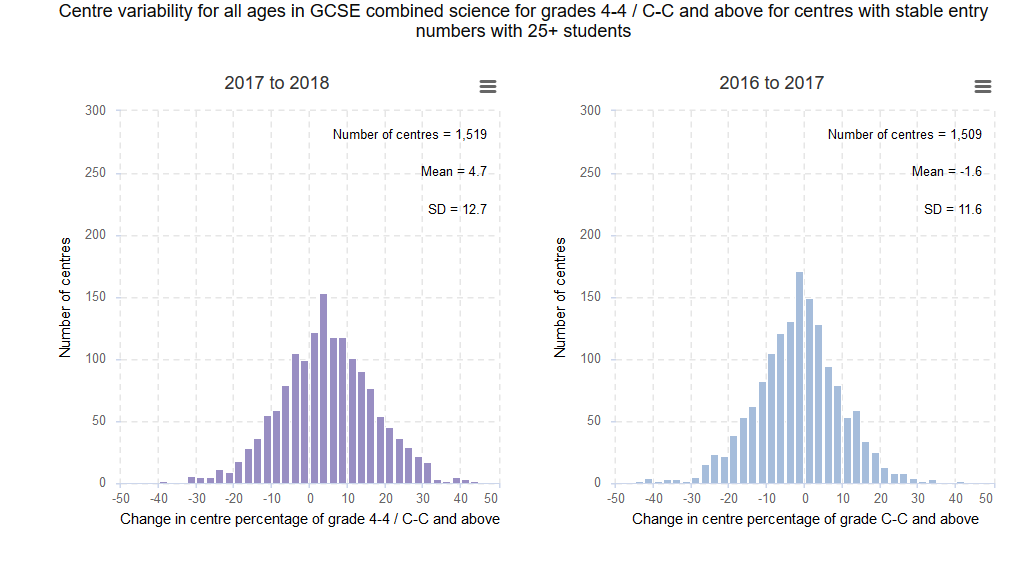
That said, Ofqual let you see the results of centres who kept their entry patterns reasonably stable and even they have seen lots of changing (and a substantial bump in scores).
GCSE History
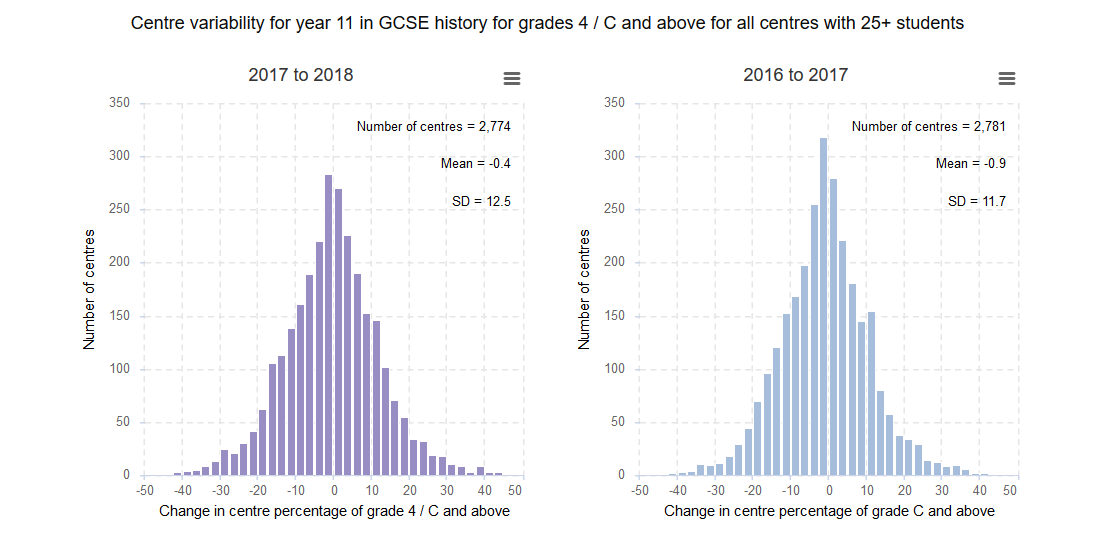
History is the subject that seems to have struggled most this year – although it was struggling last year a little too. Centres saw an average decline of 0.4 percentage points overall, and there was a fairly wide spread of results with a handful of centres dropping 40 percentage points or increasing by that much.
A sensible guess is that more pupils are being forced into history to deal with the EBacc requirements, and this makes things trickier for schools. We also heard that lots of schools were struggling to cover the whole history curriculum in time.
GCSE Geography
On the other side of the EBacc equation, however, Geography had a fairly stable year. A wide spread in the leaps – so, again, a handful with big decreases or increases – but overall the shift was only -0.1 per centage points per centre.
GCSE French
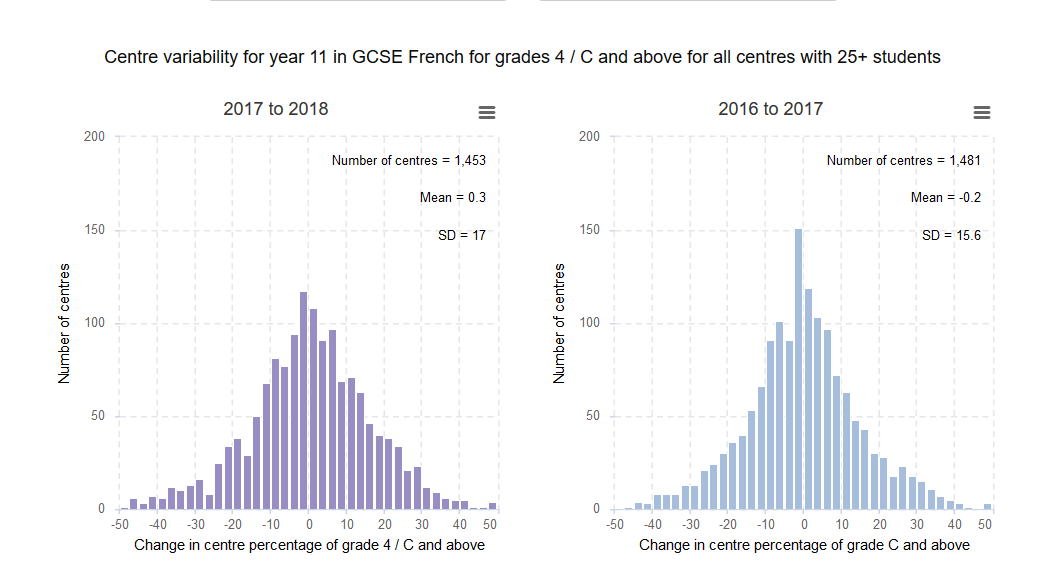
Finally, here’s the GCSE French numbers. As ever, the spread is wider than in all other subjects but overall the average centre saw results go up bu 0.3 percentage points.
In conclusion?
It’s all much of a muchness. If your science results are up – that’s great for the kids, but you may find it’s not as unusual as you think relative the rest of the country. If your history and MFL are a bit dramaticaly up or down, then you’re also not alone. With English and maths, however, things should be roughly the same.


Your thoughts