Today the government has released the provisional GCSE results in England for 2017-18, which reveal the attainment 8 and progress 8 scores across the country.
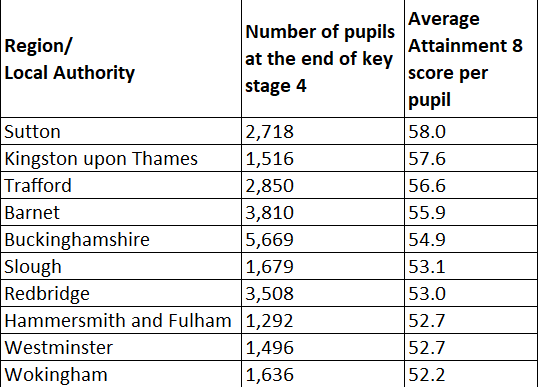
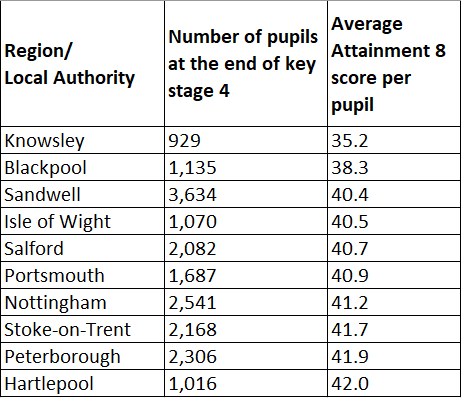
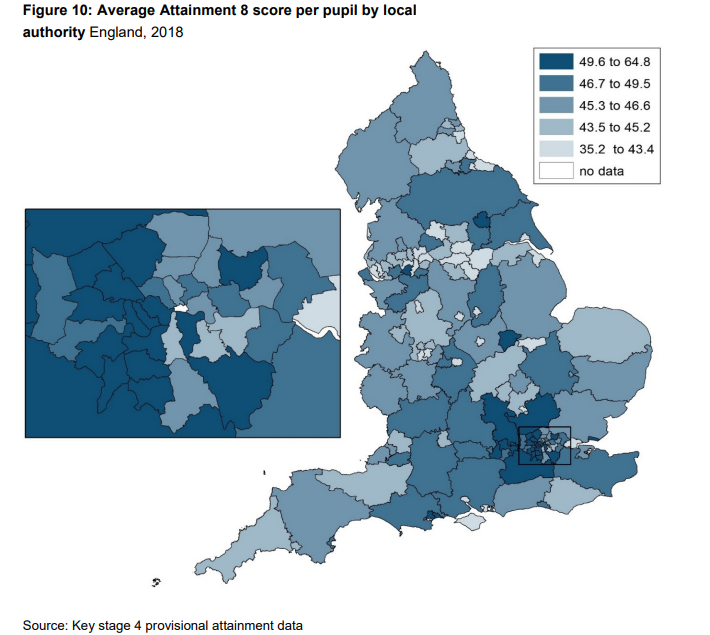
The lowest average attainment 8 score per pupil in England’s state funded schools was 35.2 this year, in Knowsley, a borough in Merseyside, while the highest was 58.0 in Sutton, London (excluding Rutland and the Isles of Scilly, where the numbers of schools are extremely small).
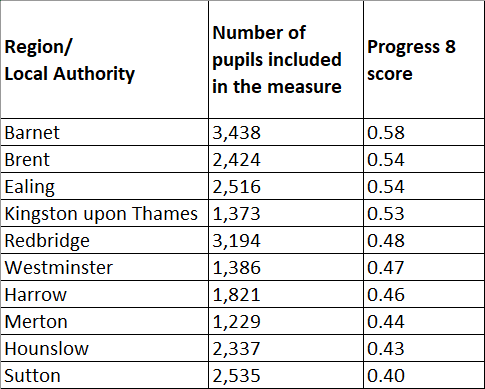
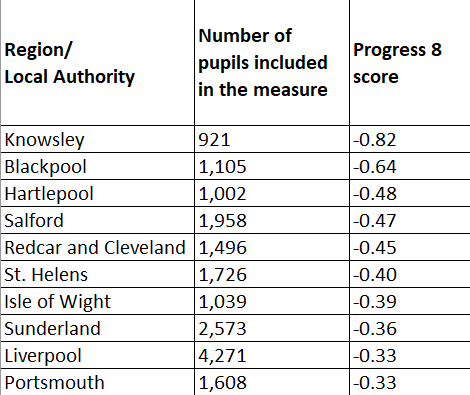
The lowest average progress 8 scores was -0.82 in Knowsley again, while the highest was 0.58 in Barnet, London.
Attainment 8 scores for pupils are calculated by adding up the points achieved in their eight English Baccalaureate subjects taken at GCSE, and dividing by 10. A school’s attainment 8 score is the average of all of its students’ scores. While students don’t have to take eight subjects, they will score zero for any unfilled slots.
Progress 8 compares pupils’ key stage 4 results to those of other pupils nationally with similar prior attainment at key stage 2. School level progress 8 scores are calculated by adding together the progress 8 scores of all the pupils in year 11 and dividing by the number of pupils in the school.
Today’s provisional data shows that the highest performing local authorities in 2018 were concentrated in London and the South. The majority of the lowest performing local authorities were located in the Northern and Midland regions, in a similar pattern to recent years.
Some schools has a few as 21 per cent of students achieving 9 to 5 grades in English and maths this year, while others had as high as 63.9 per cent, and some entered on 15.1 per cent of pupils for the EBacc, while others put in 64.8 per cent of their cohort. The lowest average EBacc point score was 2.98, and the highest was 5.31.
Schools Week took a look at which areas performed best and which came bottom of the pile.
CLARIFICATION: Schools Week has updated these tables as the Department for Education subsequently released ‘adjusted’ data that excludes pupils with extremely negative progress scores, as explained in the secondary accountability measures guidance.
Top performing regions 2018
Attainment 8
Progress 8
Worst performing regions
Attainment 8
Progress 8
Attainment 8 across the country


Your thoughts